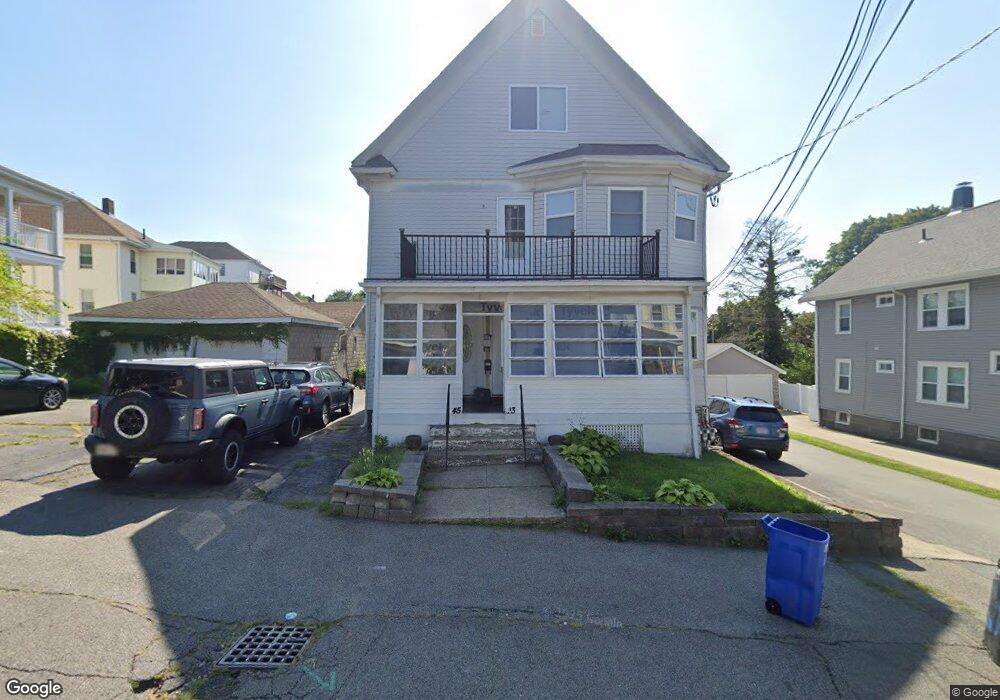
43 Bennington St Quincy, MA 02169
South Quincy NeighborhoodEstimated Value: $1,108,207 - $1,208,000
5
Beds
3
Baths
3,212
Sq Ft
$365/Sq Ft
Est. Value
About This Home
This home is located at 43 Bennington St, Quincy, MA 02169 and is currently estimated at $1,171,302, approximately $364 per square foot. 43 Bennington St is a home located in Norfolk County with nearby schools including Lincoln-Hancock Community School, South West Middle School, and Quincy High School.
Ownership History
Date
Name
Owned For
Owner Type
Purchase Details
Closed on
Jan 6, 2006
Sold by
Pellegrino Clara and Pellegrino Frank
Bought by
Ziu Julika and Ziu Seltil
Current Estimated Value
Home Financials for this Owner
Home Financials are based on the most recent Mortgage that was taken out on this home.
Original Mortgage
$480,000
Outstanding Balance
$269,956
Interest Rate
6.28%
Mortgage Type
Purchase Money Mortgage
Estimated Equity
$901,346
Create a Home Valuation Report for This Property
The Home Valuation Report is an in-depth analysis detailing your home's value as well as a comparison with similar homes in the area
Home Values in the Area
Average Home Value in this Area
Purchase History
| Date | Buyer | Sale Price | Title Company |
|---|---|---|---|
| Ziu Julika | $600,000 | -- |
Source: Public Records
Mortgage History
| Date | Status | Borrower | Loan Amount |
|---|---|---|---|
| Open | Ziu Julika | $480,000 |
Source: Public Records
Tax History
| Year | Tax Paid | Tax Assessment Tax Assessment Total Assessment is a certain percentage of the fair market value that is determined by local assessors to be the total taxable value of land and additions on the property. | Land | Improvement |
|---|---|---|---|---|
| 2025 | $13,038 | $1,130,800 | $315,100 | $815,700 |
| 2024 | $12,412 | $1,101,300 | $300,300 | $801,000 |
| 2023 | $11,333 | $1,018,200 | $273,500 | $744,700 |
| 2022 | $11,060 | $923,200 | $228,700 | $694,500 |
| 2021 | $10,877 | $896,000 | $228,700 | $667,300 |
| 2020 | $10,471 | $842,400 | $228,700 | $613,700 |
| 2019 | $10,395 | $828,300 | $216,100 | $612,200 |
| 2018 | $8,870 | $664,900 | $200,500 | $464,400 |
| 2017 | $9,015 | $636,200 | $191,100 | $445,100 |
| 2016 | $7,993 | $556,600 | $166,900 | $389,700 |
| 2015 | $7,967 | $545,700 | $166,900 | $378,800 |
| 2014 | $7,219 | $485,800 | $166,900 | $318,900 |
Source: Public Records
Map
Nearby Homes
- 192 Federal Ave Unit B
- 177 Franklin St
- 155 Kendrick Ave Unit 502
- 50 N Payne St Unit 6
- 87 Franklin St Unit 105
- 166 Phipps St
- 9 Independence Ave Unit 307
- 8 Jackson St Unit B1
- 8 Jackson St Unit B4
- 21 Totman St Unit 308
- 21 Totman St Unit 205
- 21 Totman St Unit 404
- 21 Totman St Unit 309
- 21 Totman St Unit 203
- 21 Totman St Unit PH-406
- 21 Totman St Unit 301
- 21 Totman St Unit PH-405
- 21 Totman St Unit 407
- 17 White Rd
- 51 Branch St Unit 2
- 45 Bennington St Unit 2
- 45 Bennington St
- 45 Bennington St Unit 1
- 43 Bennington St Unit 2
- 43 Bennington St Unit 1
- 43 Benningron Unit 1
- 37 Bennington St
- 49 Verchild St
- 51 Verchild St
- 43 Verchild St
- 29 Bennington St
- 42 Bennington St
- 55 Verchild St
- 38 Bennington St
- 35 Verchild St
- 34 Bennington St Unit 1
- 34 Bennington St
- 25 Bennington St
- 61 Verchild St
- 63 Verchild St
Your Personal Tour Guide
Ask me questions while you tour the home.