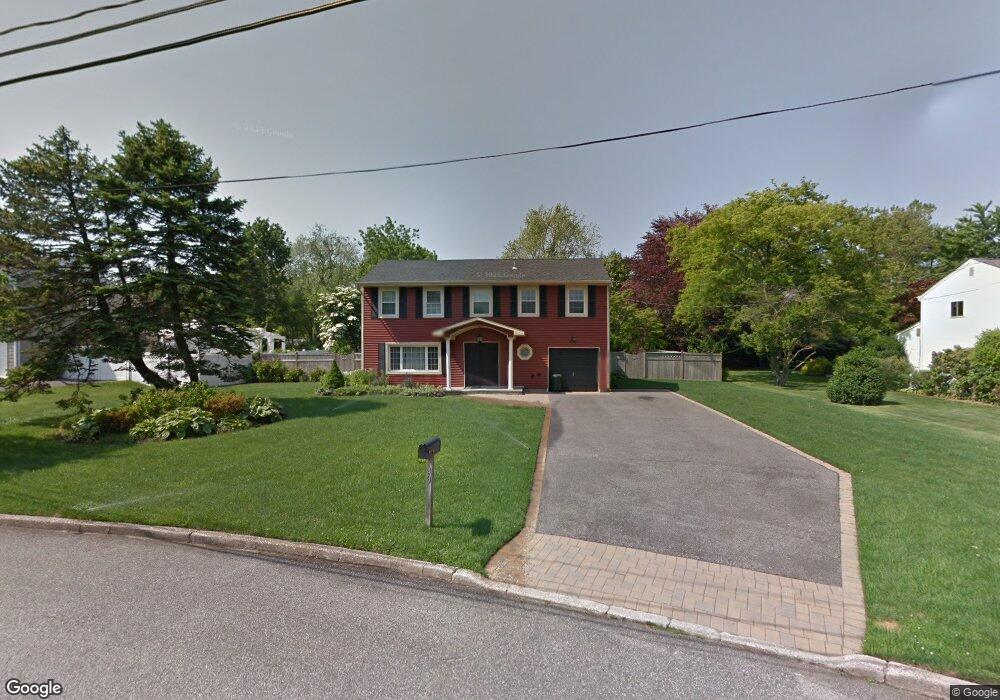
43 Block Blvd Port Jefferson Station, NY 11776
Estimated Value: $634,142 - $710,000
4
Beds
1
Bath
2,020
Sq Ft
$328/Sq Ft
Est. Value
About This Home
This home is located at 43 Block Blvd, Port Jefferson Station, NY 11776 and is currently estimated at $662,036, approximately $327 per square foot. 43 Block Blvd is a home located in Suffolk County with nearby schools including John F Kennedy Middle School and Comsewogue High School.
Ownership History
Date
Name
Owned For
Owner Type
Purchase Details
Closed on
Sep 11, 2003
Sold by
Nichols Christopher A
Bought by
Monserrat Manuel and Monserrat Esther
Current Estimated Value
Home Financials for this Owner
Home Financials are based on the most recent Mortgage that was taken out on this home.
Original Mortgage
$294,500
Outstanding Balance
$137,651
Interest Rate
6.35%
Mortgage Type
Purchase Money Mortgage
Estimated Equity
$524,385
Purchase Details
Closed on
Apr 13, 2001
Sold by
Ogborn Debra J
Bought by
Nichols Christopher A
Home Financials for this Owner
Home Financials are based on the most recent Mortgage that was taken out on this home.
Original Mortgage
$46,500
Interest Rate
6.54%
Mortgage Type
Stand Alone Second
Purchase Details
Closed on
Sep 3, 1997
Sold by
Corsa Willmont W
Bought by
Ogborn Debra J
Create a Home Valuation Report for This Property
The Home Valuation Report is an in-depth analysis detailing your home's value as well as a comparison with similar homes in the area
Home Values in the Area
Average Home Value in this Area
Purchase History
| Date | Buyer | Sale Price | Title Company |
|---|---|---|---|
| Monserrat Manuel | $310,000 | Fidelity National Title Ins | |
| Nichols Christopher A | $232,500 | Chicago Title Insurance Co | |
| Ogborn Debra J | $135,000 | Venture Title Agency Inc |
Source: Public Records
Mortgage History
| Date | Status | Borrower | Loan Amount |
|---|---|---|---|
| Open | Monserrat Manuel | $294,500 | |
| Previous Owner | Nichols Christopher A | $46,500 | |
| Previous Owner | Nichols Christopher A | $186,000 |
Source: Public Records
Tax History Compared to Growth
Tax History
| Year | Tax Paid | Tax Assessment Tax Assessment Total Assessment is a certain percentage of the fair market value that is determined by local assessors to be the total taxable value of land and additions on the property. | Land | Improvement |
|---|---|---|---|---|
| 2024 | $10,871 | $2,790 | $300 | $2,490 |
| 2023 | $10,871 | $2,790 | $300 | $2,490 |
| 2022 | $9,578 | $2,790 | $300 | $2,490 |
| 2021 | $9,578 | $2,790 | $300 | $2,490 |
| 2020 | $9,824 | $2,790 | $300 | $2,490 |
| 2019 | $9,824 | $0 | $0 | $0 |
| 2018 | $9,348 | $2,790 | $300 | $2,490 |
| 2017 | $9,348 | $2,790 | $300 | $2,490 |
| 2016 | $9,269 | $2,790 | $300 | $2,490 |
| 2015 | -- | $2,790 | $300 | $2,490 |
| 2014 | -- | $2,790 | $300 | $2,490 |
Source: Public Records
Map
Nearby Homes