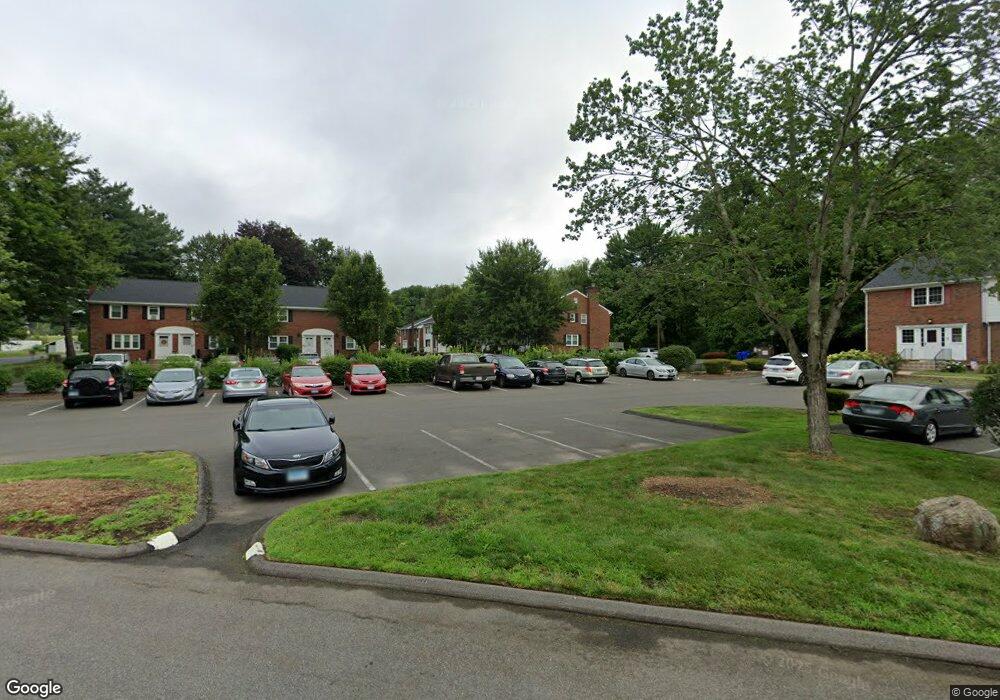
43 Brandywine Ln Suffield, CT 06078
Estimated Value: $245,235 - $254,000
2
Beds
2
Baths
1,292
Sq Ft
$192/Sq Ft
Est. Value
About This Home
This home is located at 43 Brandywine Ln, Suffield, CT 06078 and is currently estimated at $248,309, approximately $192 per square foot. 43 Brandywine Ln is a home located in Hartford County with nearby schools including A. Ward Spaulding School, Mcalister Intermediate School, and Suffield Middle School.
Ownership History
Date
Name
Owned For
Owner Type
Purchase Details
Closed on
Jan 31, 2023
Sold by
Koczon Andrew H
Bought by
Kane Erica
Current Estimated Value
Home Financials for this Owner
Home Financials are based on the most recent Mortgage that was taken out on this home.
Original Mortgage
$195,700
Outstanding Balance
$188,446
Interest Rate
6.31%
Mortgage Type
Purchase Money Mortgage
Estimated Equity
$59,863
Purchase Details
Closed on
Jan 26, 2017
Sold by
Loesch Joanne and Koczon Andrew H
Bought by
Koczon Andrew H
Home Financials for this Owner
Home Financials are based on the most recent Mortgage that was taken out on this home.
Original Mortgage
$132,500
Interest Rate
4.16%
Mortgage Type
New Conventional
Purchase Details
Closed on
Nov 4, 1997
Sold by
Hampson Scott and Hampson Debra
Bought by
Loesch Joanne
Create a Home Valuation Report for This Property
The Home Valuation Report is an in-depth analysis detailing your home's value as well as a comparison with similar homes in the area
Home Values in the Area
Average Home Value in this Area
Purchase History
| Date | Buyer | Sale Price | Title Company |
|---|---|---|---|
| Kane Erica | $206,000 | None Available | |
| Koczon Andrew H | $132,500 | -- | |
| Loesch Joanne | $72,000 | -- |
Source: Public Records
Mortgage History
| Date | Status | Borrower | Loan Amount |
|---|---|---|---|
| Open | Kane Erica | $195,700 | |
| Previous Owner | Koczon Andrew H | $132,500 | |
| Previous Owner | Loesch Joanne | $100,000 | |
| Previous Owner | Loesch Joanne | $23,000 | |
| Previous Owner | Loesch Joanne | $57,500 |
Source: Public Records
Tax History
| Year | Tax Paid | Tax Assessment Tax Assessment Total Assessment is a certain percentage of the fair market value that is determined by local assessors to be the total taxable value of land and additions on the property. | Land | Improvement |
|---|---|---|---|---|
| 2025 | $3,074 | $131,320 | $0 | $131,320 |
| 2024 | $2,972 | $131,320 | $0 | $131,320 |
| 2023 | $2,740 | $95,760 | $0 | $95,760 |
| 2022 | $2,740 | $95,760 | $0 | $95,760 |
| 2021 | $2,743 | $95,760 | $0 | $95,760 |
| 2020 | $2,743 | $95,760 | $0 | $95,760 |
| 2019 | $2,722 | $94,780 | $0 | $94,780 |
| 2018 | $2,865 | $97,720 | $0 | $97,720 |
| 2017 | $2,823 | $97,720 | $0 | $97,720 |
| 2016 | $2,756 | $97,720 | $0 | $97,720 |
| 2015 | $2,715 | $97,720 | $0 | $97,720 |
| 2014 | $2,650 | $97,720 | $0 | $97,720 |
Source: Public Records
Map
Nearby Homes
- 61 Brandywine Ln
- 15 High St
- 186 S Main St
- 39 Marbern Dr
- 424 Bridge St
- 0 Stone St S Unit 24039713
- 0 Suffield St Unit 24093452
- 0 Suffield St Unit 24057050
- 1 E Elaine Dr
- 18 Daniel Cir Unit 18
- 392 Boston Neck Rd
- 713 Thrall Ave
- 779 Bridge St
- 278 Thompsonville Rd
- 72 Spencer St
- 105 1st St
- 98 1st St
- 840 Branch Rd
- 3 Pebblestone Cir Unit 3
- 610 East St S
- 46 Brandywine Ln
- 45 Brandywine Ln
- 44 Brandywine Ln
- 42 Brandywine Ln
- 41 Brandywine Ln
- 40 Brandywine Ln
- 39 Brandywine Ln
- 38 Brandywine Ln
- 37 Brandywine Ln
- 36 Brandywine Ln
- 39 Brandywine Ln Unit 39
- 44 Brandywine Ln Unit 44
- 46 Brandywine Ln Unit 46
- 42 Brandywine Ln Unit 42
- 41 Brandywine Ln Unit 41
- 43 Brandywine Ln Unit 43
- 30 Brandywine Ln
- 30 Brandywine Ln Unit 30
- 28 Brandywine Ln
- 28 Brandywine Ln Unit 28
Your Personal Tour Guide
Ask me questions while you tour the home.