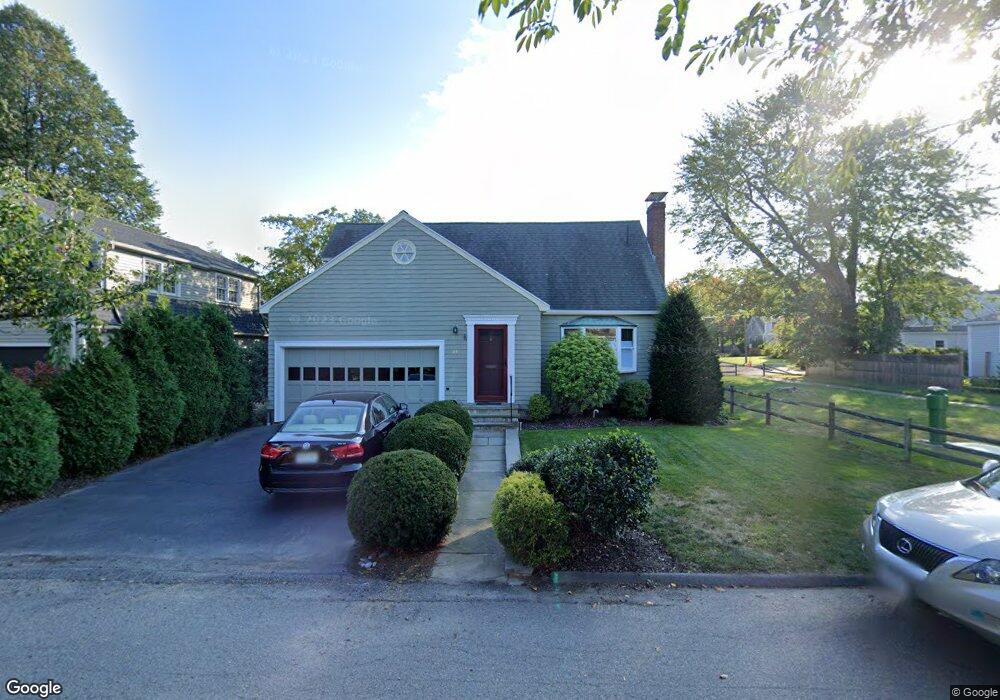
43 Bubier Rd Marblehead, MA 01945
Estimated Value: $1,012,000 - $1,157,000
2
Beds
2
Baths
2,064
Sq Ft
$531/Sq Ft
Est. Value
About This Home
This home is located at 43 Bubier Rd, Marblehead, MA 01945 and is currently estimated at $1,096,267, approximately $531 per square foot. 43 Bubier Rd is a home located in Essex County with nearby schools including Marblehead High School, Devereux School, and Tower School.
Ownership History
Date
Name
Owned For
Owner Type
Purchase Details
Closed on
Feb 12, 2010
Sold by
Priscilla M Barr T
Bought by
Hassett John J
Current Estimated Value
Home Financials for this Owner
Home Financials are based on the most recent Mortgage that was taken out on this home.
Original Mortgage
$300,000
Interest Rate
5.12%
Mortgage Type
Purchase Money Mortgage
Create a Home Valuation Report for This Property
The Home Valuation Report is an in-depth analysis detailing your home's value as well as a comparison with similar homes in the area
Home Values in the Area
Average Home Value in this Area
Purchase History
| Date | Buyer | Sale Price | Title Company |
|---|---|---|---|
| Hassett John J | $455,000 | -- | |
| Hassett John J | $455,000 | -- |
Source: Public Records
Mortgage History
| Date | Status | Borrower | Loan Amount |
|---|---|---|---|
| Open | Hassett John J | $205,000 | |
| Closed | Hassett John J | $237,000 | |
| Closed | Hassett John J | $282,000 | |
| Closed | Hassett John J | $300,000 |
Source: Public Records
Tax History
| Year | Tax Paid | Tax Assessment Tax Assessment Total Assessment is a certain percentage of the fair market value that is determined by local assessors to be the total taxable value of land and additions on the property. | Land | Improvement |
|---|---|---|---|---|
| 2025 | $9,342 | $1,032,300 | $747,500 | $284,800 |
| 2024 | $8,957 | $999,700 | $805,000 | $194,700 |
| 2023 | $7,723 | $772,300 | $563,500 | $208,800 |
| 2022 | $7,745 | $736,200 | $529,000 | $207,200 |
| 2021 | $7,671 | $736,200 | $529,000 | $207,200 |
| 2020 | $6,977 | $671,500 | $494,500 | $177,000 |
| 2019 | $6,453 | $600,800 | $425,500 | $175,300 |
| 2018 | $6,323 | $573,800 | $419,800 | $154,000 |
| 2017 | $6,276 | $570,000 | $414,000 | $156,000 |
| 2016 | $5,899 | $531,400 | $391,000 | $140,400 |
| 2015 | $5,024 | $453,400 | $322,000 | $131,400 |
| 2014 | $4,469 | $403,000 | $276,000 | $127,000 |
Source: Public Records
Map
Nearby Homes
- 23 Wyman Rd
- 4 Gallison Ave
- 290 Washington St Unit A
- 282 Pleasant St
- 55 Brackett Place Unit B
- 70 Maverick St
- 30 Haley Rd Unit 1
- 6 Mount Vernon St
- 66 Pleasant St Unit 1
- 66 Pleasant St Unit 2
- 26 Summer St Unit 1
- 132 Elm St
- 132 Elm St Unit 132
- 45 Pleasant St
- 9 Darling St
- 3 Frost Ln Unit 1
- 7 Mechanic Ct
- 4 Dean Rd
- 1 Knollwood Rd
- 12 Pickwick Rd
Your Personal Tour Guide
Ask me questions while you tour the home.