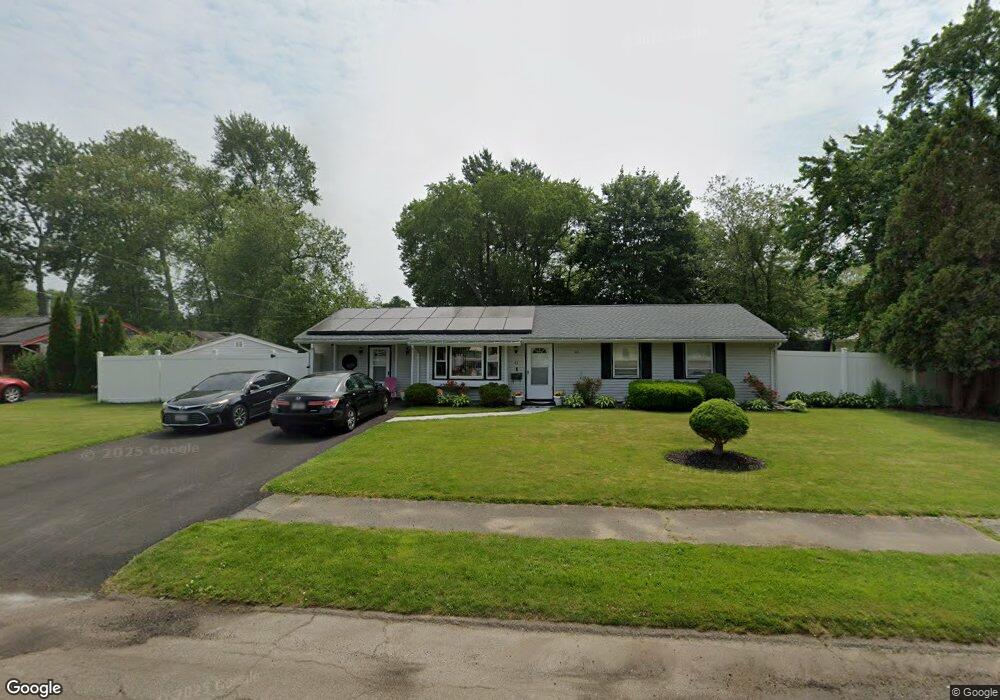
43 Burdett Rd Brockton, MA 02302
Estimated Value: $466,000 - $516,000
3
Beds
1
Bath
1,316
Sq Ft
$371/Sq Ft
Est. Value
About This Home
This home is located at 43 Burdett Rd, Brockton, MA 02302 and is currently estimated at $487,727, approximately $370 per square foot. 43 Burdett Rd is a home located in Plymouth County with nearby schools including Davis K-8 School, John F. Kennedy Elementary School, and South Middle School.
Ownership History
Date
Name
Owned For
Owner Type
Purchase Details
Closed on
Jun 13, 1997
Sold by
Usa Va
Bought by
Pierre Ketly F and Pierre Charlot
Current Estimated Value
Purchase Details
Closed on
Apr 4, 1997
Sold by
Whittemore Robert J and Usa Va
Bought by
Usa Va
Purchase Details
Closed on
Aug 14, 1990
Sold by
Tevault James M
Bought by
Whittemore Robert J
Create a Home Valuation Report for This Property
The Home Valuation Report is an in-depth analysis detailing your home's value as well as a comparison with similar homes in the area
Home Values in the Area
Average Home Value in this Area
Purchase History
| Date | Buyer | Sale Price | Title Company |
|---|---|---|---|
| Pierre Ketly F | $95,851 | -- | |
| Usa Va | $69,128 | -- | |
| Whittemore Robert J | $123,900 | -- |
Source: Public Records
Mortgage History
| Date | Status | Borrower | Loan Amount |
|---|---|---|---|
| Open | Whittemore Robert J | $181,200 | |
| Closed | Whittemore Robert J | $145,000 | |
| Closed | Whittemore Robert J | $120,000 |
Source: Public Records
Tax History Compared to Growth
Tax History
| Year | Tax Paid | Tax Assessment Tax Assessment Total Assessment is a certain percentage of the fair market value that is determined by local assessors to be the total taxable value of land and additions on the property. | Land | Improvement |
|---|---|---|---|---|
| 2025 | $4,826 | $398,500 | $162,500 | $236,000 |
| 2024 | $4,735 | $393,900 | $162,500 | $231,400 |
| 2023 | $4,562 | $351,500 | $112,900 | $238,600 |
| 2022 | $4,223 | $302,300 | $102,600 | $199,700 |
| 2021 | $4,266 | $294,200 | $96,000 | $198,200 |
| 2020 | $4,172 | $275,400 | $84,000 | $191,400 |
| 2019 | $3,882 | $249,800 | $80,500 | $169,300 |
| 2018 | $3,694 | $230,000 | $80,500 | $149,500 |
| 2017 | $3,101 | $192,600 | $80,500 | $112,100 |
| 2016 | $3,347 | $192,800 | $76,700 | $116,100 |
| 2015 | $2,875 | $158,400 | $76,700 | $81,700 |
| 2014 | $3,104 | $171,200 | $76,700 | $94,500 |
Source: Public Records
Map
Nearby Homes