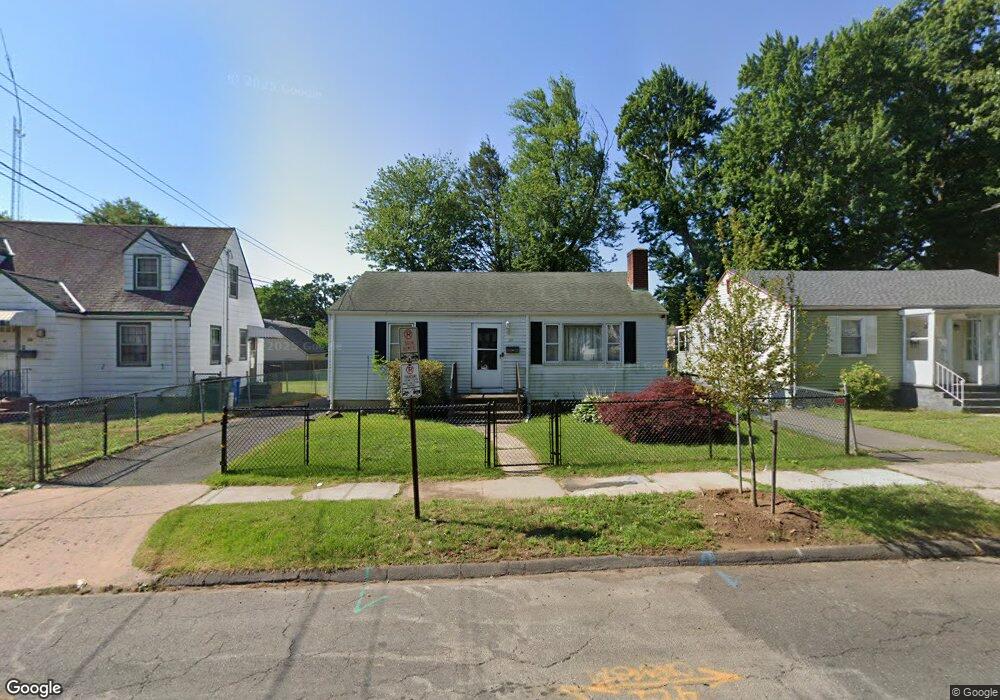
43 Burnham St Hartford, CT 06112
Blue Hills NeighborhoodEstimated Value: $235,000 - $282,000
3
Beds
1
Bath
986
Sq Ft
$258/Sq Ft
Est. Value
About This Home
This home is located at 43 Burnham St, Hartford, CT 06112 and is currently estimated at $254,376, approximately $257 per square foot. 43 Burnham St is a home located in Hartford County with nearby schools including Rawson School, Breakthrough Magnet School - North Campus, and West Middle School.
Ownership History
Date
Name
Owned For
Owner Type
Purchase Details
Closed on
Sep 8, 1995
Sold by
Lewis Charles and Lewis Lois
Bought by
Cook Freddie and Cook Deirdre
Current Estimated Value
Home Financials for this Owner
Home Financials are based on the most recent Mortgage that was taken out on this home.
Original Mortgage
$65,500
Interest Rate
7.8%
Mortgage Type
Purchase Money Mortgage
Create a Home Valuation Report for This Property
The Home Valuation Report is an in-depth analysis detailing your home's value as well as a comparison with similar homes in the area
Home Values in the Area
Average Home Value in this Area
Purchase History
| Date | Buyer | Sale Price | Title Company |
|---|---|---|---|
| Cook Freddie | $69,000 | -- |
Source: Public Records
Mortgage History
| Date | Status | Borrower | Loan Amount |
|---|---|---|---|
| Closed | Cook Freddie | $78,923 | |
| Closed | Cook Freddie | $7,500 | |
| Closed | Cook Freddie | $10,000 | |
| Closed | Cook Freddie | $65,500 |
Source: Public Records
Tax History Compared to Growth
Tax History
| Year | Tax Paid | Tax Assessment Tax Assessment Total Assessment is a certain percentage of the fair market value that is determined by local assessors to be the total taxable value of land and additions on the property. | Land | Improvement |
|---|---|---|---|---|
| 2025 | $3,905 | $56,632 | $5,880 | $50,752 |
| 2024 | $3,905 | $56,632 | $5,880 | $50,752 |
| 2023 | $3,905 | $56,632 | $5,880 | $50,752 |
| 2022 | $3,905 | $56,632 | $5,880 | $50,752 |
| 2021 | $3,131 | $42,140 | $6,930 | $35,210 |
| 2020 | $3,131 | $42,140 | $6,930 | $35,210 |
| 2019 | $3,131 | $42,140 | $6,930 | $35,210 |
| 2018 | $3,025 | $40,719 | $6,696 | $34,023 |
| 2016 | $2,831 | $38,104 | $6,377 | $31,727 |
| 2015 | $2,831 | $36,294 | $6,074 | $30,220 |
| 2014 | $2,630 | $35,407 | $5,926 | $29,481 |
Source: Public Records
Map
Nearby Homes
- 70 Burnham St Unit 72
- 125 Lebanon St Unit 127
- 11 Pershing St Unit 13
- 86 Hartland St
- 152 Burnham St
- 147 Morningside St W
- 10 Baltic St Unit 12
- 180 Brookline Ave
- 36 Baltic St Unit 38
- 90 Manchester St
- 97 E Burnham St
- 355 Cornwall St Unit 357
- 97 Boothbay St
- 171 N Canaan St
- 67 Elizabeth Ave
- 179 Manchester St
- 52 Greenwood Ave
- 117 E Harold St
- 117 E Pershing St
- 175 E Pershing St
- 39 Burnham St
- 47 Burnham St
- 35 Burnham St
- 51 Burnham St
- 53 Burnham St Unit 55
- 149 Salisbury St
- 44 Harold St Unit 46
- 44 Harold St
- 40 Harold St Unit 42
- 54 Harold St
- 48 Harold St Unit 50
- 4 Cornell St
- 5 Cornell St
- 38 Burnham St
- 58 Harold St
- 34 Burnham St
- 57 Burnham St
- 160 Salisbury St
- 30 Burnham St Unit 32
- 54 Burnham St