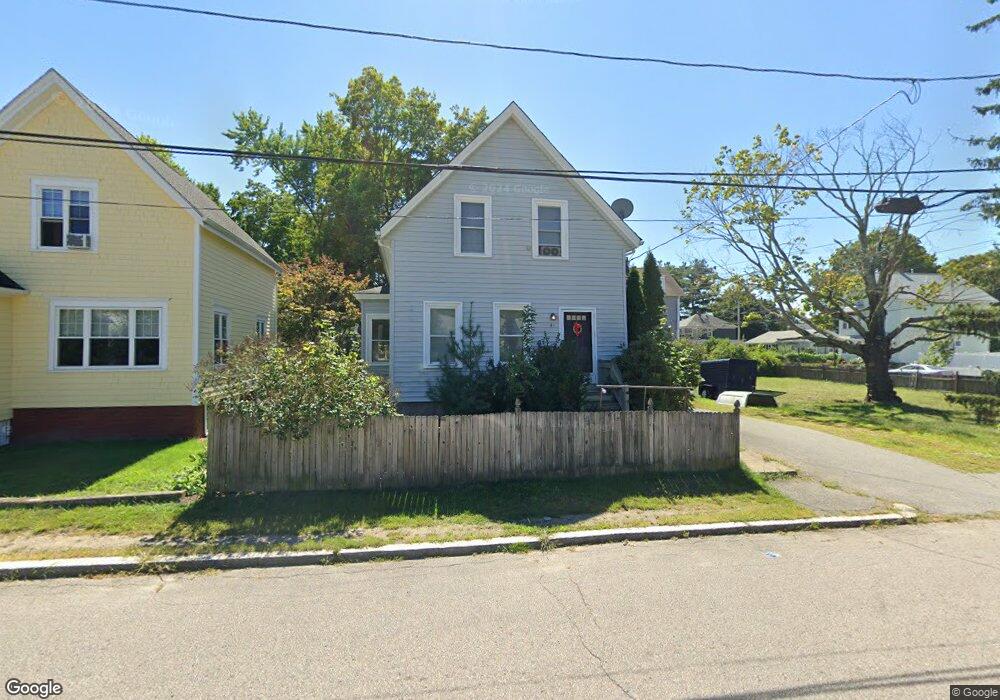
43 Carpenter St Attleboro, MA 02703
Estimated Value: $414,000 - $435,165
3
Beds
2
Baths
1,176
Sq Ft
$361/Sq Ft
Est. Value
About This Home
This home is located at 43 Carpenter St, Attleboro, MA 02703 and is currently estimated at $425,041, approximately $361 per square foot. 43 Carpenter St is a home located in Bristol County with nearby schools including Peter Thacher Elementary School, Wamsutta Middle School, and Attleboro High School.
Ownership History
Date
Name
Owned For
Owner Type
Purchase Details
Closed on
Jul 7, 2025
Sold by
Sousa Christine Est and Melo
Bought by
Melo Kristyn L and Sousa Nathin
Current Estimated Value
Purchase Details
Closed on
Jul 1, 2025
Sold by
Melo Kristyn L and Sousa Nathin
Bought by
Sousa Nathin J
Purchase Details
Closed on
Mar 24, 2006
Sold by
Sousa Christine and Cloud Christine
Bought by
Sousa Christine
Home Financials for this Owner
Home Financials are based on the most recent Mortgage that was taken out on this home.
Original Mortgage
$221,250
Interest Rate
6.28%
Mortgage Type
Purchase Money Mortgage
Purchase Details
Closed on
Nov 18, 2003
Sold by
Sousa Christine and Cloud Christine
Bought by
Sousa Christine and Cloud Christine
Purchase Details
Closed on
Oct 18, 2002
Sold by
Groft Teresa A and Could John P
Bought by
Sousa Christina C
Home Financials for this Owner
Home Financials are based on the most recent Mortgage that was taken out on this home.
Original Mortgage
$144,000
Interest Rate
6.18%
Mortgage Type
Purchase Money Mortgage
Create a Home Valuation Report for This Property
The Home Valuation Report is an in-depth analysis detailing your home's value as well as a comparison with similar homes in the area
Home Values in the Area
Average Home Value in this Area
Purchase History
| Date | Buyer | Sale Price | Title Company |
|---|---|---|---|
| Melo Kristyn L | -- | -- | |
| Melo Kristyn L | -- | -- | |
| Sousa Nathin J | -- | -- | |
| Sousa Nathin J | -- | -- | |
| Sousa Christine | $73,000 | -- | |
| Sousa Christine | $73,000 | -- | |
| Sousa Christine | -- | -- | |
| Sousa Christine | -- | -- | |
| Sousa Christina C | $180,000 | -- | |
| Sousa Christina C | $180,000 | -- |
Source: Public Records
Mortgage History
| Date | Status | Borrower | Loan Amount |
|---|---|---|---|
| Previous Owner | Sousa Christine | $221,250 | |
| Previous Owner | Sousa Christina C | $144,000 |
Source: Public Records
Tax History Compared to Growth
Tax History
| Year | Tax Paid | Tax Assessment Tax Assessment Total Assessment is a certain percentage of the fair market value that is determined by local assessors to be the total taxable value of land and additions on the property. | Land | Improvement |
|---|---|---|---|---|
| 2025 | $4,024 | $320,600 | $128,400 | $192,200 |
| 2024 | $4,041 | $317,400 | $128,400 | $189,000 |
| 2023 | $3,896 | $284,600 | $116,700 | $167,900 |
| 2022 | $3,792 | $262,400 | $111,200 | $151,200 |
| 2021 | $3,506 | $236,900 | $106,800 | $130,100 |
| 2020 | $3,439 | $236,200 | $103,900 | $132,300 |
| 2019 | $3,213 | $226,900 | $101,900 | $125,000 |
| 2018 | $4,181 | $206,600 | $98,800 | $107,800 |
| 2017 | $3,031 | $208,300 | $98,800 | $109,500 |
| 2016 | $2,780 | $187,600 | $92,400 | $95,200 |
| 2015 | $2,555 | $173,700 | $92,400 | $81,300 |
| 2014 | $2,478 | $166,900 | $87,500 | $79,400 |
Source: Public Records
Map
Nearby Homes