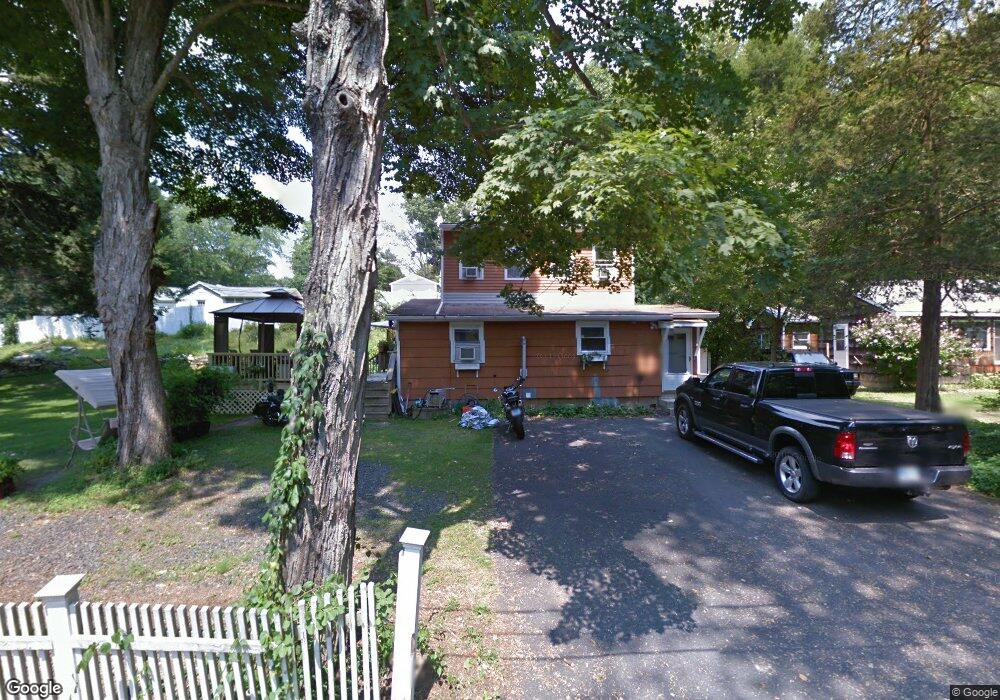
43 Cedar Trail Southbury, CT 06488
Estimated Value: $339,000 - $362,000
3
Beds
2
Baths
1,260
Sq Ft
$277/Sq Ft
Est. Value
About This Home
This home is located at 43 Cedar Trail, Southbury, CT 06488 and is currently estimated at $349,616, approximately $277 per square foot. 43 Cedar Trail is a home located in New Haven County with nearby schools including Gainfield Elementary School, Rochambeau Middle School, and Pomperaug Regional High School.
Ownership History
Date
Name
Owned For
Owner Type
Purchase Details
Closed on
Oct 4, 2024
Sold by
Rothe Candice and Rothe Lori
Bought by
Rothe Candice and Rothe Lori
Current Estimated Value
Home Financials for this Owner
Home Financials are based on the most recent Mortgage that was taken out on this home.
Original Mortgage
$50,001
Interest Rate
6.76%
Mortgage Type
New Conventional
Purchase Details
Closed on
Oct 6, 2009
Sold by
Rothe Candice
Bought by
Rothe Candice and Lunt Lori
Purchase Details
Closed on
May 6, 2009
Sold by
Kenny Justine and Rothe Candice
Bought by
Rothe Candice
Purchase Details
Closed on
Jun 4, 2004
Sold by
Rothe Clifford and Rothe Gail
Bought by
Rothe Candice and Kenney Justine
Create a Home Valuation Report for This Property
The Home Valuation Report is an in-depth analysis detailing your home's value as well as a comparison with similar homes in the area
Home Values in the Area
Average Home Value in this Area
Purchase History
| Date | Buyer | Sale Price | Title Company |
|---|---|---|---|
| Rothe Candice | -- | None Available | |
| Rothe Candice | -- | -- | |
| Rothe Candice | $20,000 | -- | |
| Rothe Candice | $150,000 | -- |
Source: Public Records
Mortgage History
| Date | Status | Borrower | Loan Amount |
|---|---|---|---|
| Previous Owner | Rothe Candice | $50,001 | |
| Previous Owner | Rothe Candice | $177,500 | |
| Previous Owner | Rothe Candice | $175,050 | |
| Previous Owner | Rothe Candice | $152,000 |
Source: Public Records
Tax History Compared to Growth
Tax History
| Year | Tax Paid | Tax Assessment Tax Assessment Total Assessment is a certain percentage of the fair market value that is determined by local assessors to be the total taxable value of land and additions on the property. | Land | Improvement |
|---|---|---|---|---|
| 2025 | $4,363 | $180,290 | $64,940 | $115,350 |
| 2024 | $4,255 | $180,290 | $64,940 | $115,350 |
| 2023 | $4,057 | $180,290 | $64,940 | $115,350 |
| 2022 | $3,417 | $119,310 | $49,570 | $69,740 |
| 2021 | $3,496 | $119,310 | $49,570 | $69,740 |
| 2020 | $3,496 | $119,310 | $49,570 | $69,740 |
| 2019 | $3,472 | $119,310 | $49,570 | $69,740 |
| 2018 | $3,460 | $119,310 | $49,570 | $69,740 |
| 2017 | $3,402 | $116,120 | $54,930 | $61,190 |
| 2016 | $3,344 | $116,120 | $54,930 | $61,190 |
| 2015 | $3,298 | $116,120 | $54,930 | $61,190 |
| 2014 | $3,205 | $116,120 | $54,930 | $61,190 |
Source: Public Records
Map
Nearby Homes
- 254 Heritage Village Unit D
- 433 Heritage Village Unit A
- 230 Old Field Rd
- 327 Heritage Village Unit B
- 313 Heritage Village Unit D
- 312 Heritage Village Unit A
- 300 Heritage Village Unit B
- 0 Troupe Trail Unit 24128305
- 278 Heritage Village Unit B
- 277 Heritage Village Unit A
- 401 Heritage Village Unit B
- 399 Heritage Village Unit D
- 257 Heritage Village Unit B
- 405 Heritage Village Unit D
- 252 Heritage Village Unit A
- 546 Heritage Village Unit B
- 419 Heritage Village Unit B
- 241 Heritage Village Unit E
- 563 Heritage Village Unit F
- 95 Old Poverty Rd
- 53 Cedar Trail
- 35 Cedar Trail
- 44 Spring Trail
- 40 Cedar Trail
- 40 Northern Trail
- 30 Spring Trail
- 37 Northern Trail
- 54 Cedar Trail
- 45 Midland Trail
- 45 Midland Trail Unit 2
- 41 Midland Trail
- 21 Cedar Trail
- 33 Midland Trail
- 44 Northern Trail
- 24 Midland Trail
- 48 Northern Trail
- 34 Northern Trail
- 29 Spring Trail
- 20 Spring Trail
- 18 Cedar Trail