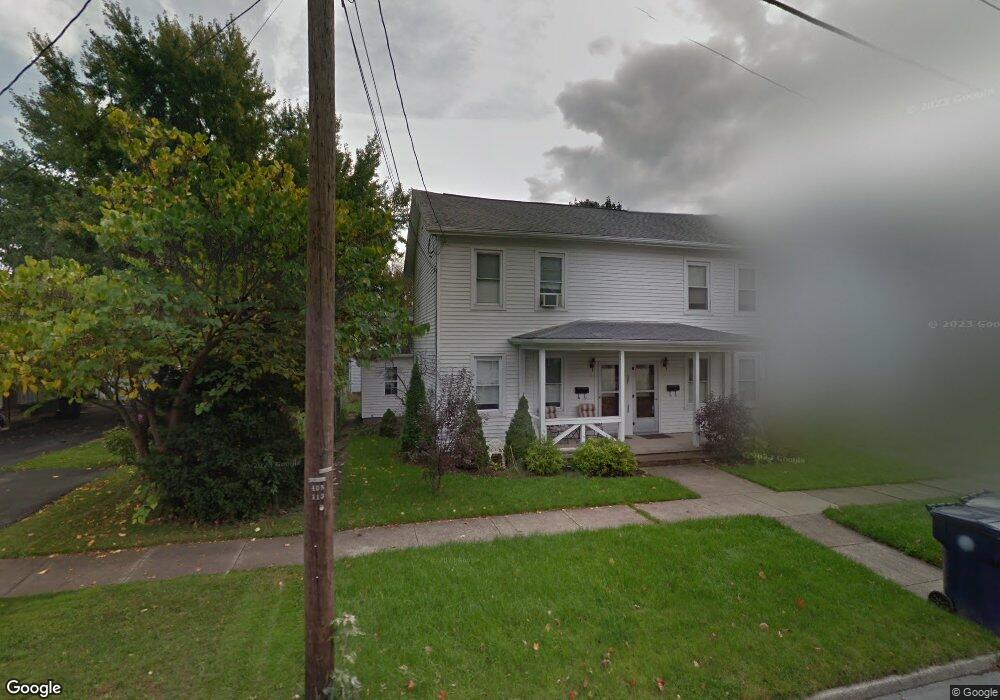
43 Chapel St Unit 45 Seneca Falls, NY 13148
Estimated Value: $149,000 - $167,000
5
Beds
3
Baths
2,220
Sq Ft
$71/Sq Ft
Est. Value
About This Home
This home is located at 43 Chapel St Unit 45, Seneca Falls, NY 13148 and is currently estimated at $157,634, approximately $71 per square foot. 43 Chapel St Unit 45 is a home located in Seneca County with nearby schools including Frank M. Knight Elementary School, Elizabeth Cady Stanton Elementary School, and Seneca Falls Middle School.
Ownership History
Date
Name
Owned For
Owner Type
Purchase Details
Closed on
May 16, 2008
Sold by
Conant Michelle
Bought by
Clark Winfred
Current Estimated Value
Purchase Details
Closed on
Jun 7, 2006
Sold by
Clark Winfred Mellodie
Bought by
Conant Michelle
Purchase Details
Closed on
Jun 26, 2002
Sold by
Conant Michelle A
Bought by
Clark Winfred Mellodie
Purchase Details
Closed on
Jun 5, 2002
Sold by
Beals Stephen A and Beals Karen H
Bought by
Conant Michelle A
Create a Home Valuation Report for This Property
The Home Valuation Report is an in-depth analysis detailing your home's value as well as a comparison with similar homes in the area
Home Values in the Area
Average Home Value in this Area
Purchase History
| Date | Buyer | Sale Price | Title Company |
|---|---|---|---|
| Clark Winfred | -- | Thomas Wolff | |
| Conant Michelle | -- | Michael Mirras | |
| Clark Winfred Mellodie | -- | -- | |
| Conant Michelle A | $52,500 | Michael Mirras |
Source: Public Records
Tax History Compared to Growth
Tax History
| Year | Tax Paid | Tax Assessment Tax Assessment Total Assessment is a certain percentage of the fair market value that is determined by local assessors to be the total taxable value of land and additions on the property. | Land | Improvement |
|---|---|---|---|---|
| 2024 | $3,594 | $120,000 | $8,100 | $111,900 |
| 2023 | $3,605 | $120,000 | $8,100 | $111,900 |
| 2022 | $3,631 | $78,000 | $12,000 | $66,000 |
| 2021 | $3,608 | $78,000 | $12,000 | $66,000 |
| 2020 | $2,892 | $78,000 | $12,000 | $66,000 |
| 2019 | $2,727 | $78,000 | $12,000 | $66,000 |
| 2018 | $2,782 | $78,000 | $12,000 | $66,000 |
| 2017 | $2,760 | $78,000 | $12,000 | $66,000 |
| 2016 | $3,547 | $78,000 | $12,000 | $66,000 |
| 2015 | -- | $72,500 | $12,200 | $60,300 |
| 2014 | -- | $72,500 | $12,200 | $60,300 |
Source: Public Records
Map
Nearby Homes