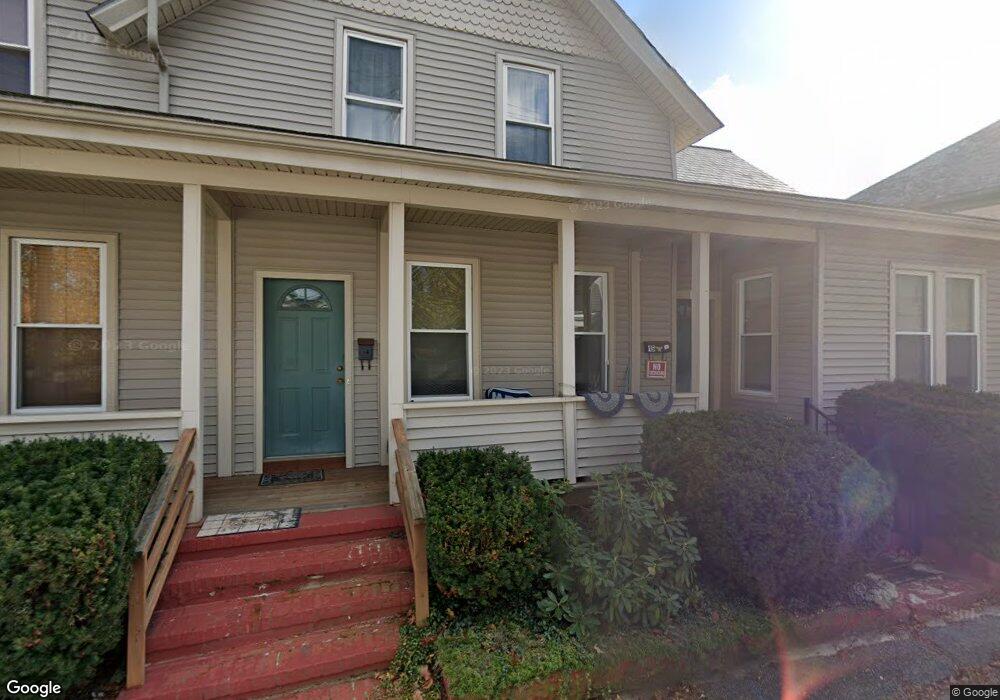
43 Chapin St Unit 2 Southbridge, MA 01550
Estimated Value: $454,000 - $497,000
2
Beds
1
Bath
1,150
Sq Ft
$417/Sq Ft
Est. Value
About This Home
This home is located at 43 Chapin St Unit 2, Southbridge, MA 01550 and is currently estimated at $480,026, approximately $417 per square foot. 43 Chapin St Unit 2 is a home located in Worcester County with nearby schools including Trinity Catholic Academy and ViewPoint Christian Academy.
Ownership History
Date
Name
Owned For
Owner Type
Purchase Details
Closed on
Jun 16, 2023
Sold by
Delrossi Dorothy A Est and Lamoureux
Bought by
Cuenca Hugo R
Current Estimated Value
Home Financials for this Owner
Home Financials are based on the most recent Mortgage that was taken out on this home.
Original Mortgage
$422,211
Outstanding Balance
$410,921
Interest Rate
6.39%
Mortgage Type
FHA
Estimated Equity
$69,105
Purchase Details
Closed on
Jun 18, 2007
Sold by
Delrossi Vincent C Est and Delrossi
Bought by
Delrossi Dorothy A and Lamoureux Elizabeth M
Create a Home Valuation Report for This Property
The Home Valuation Report is an in-depth analysis detailing your home's value as well as a comparison with similar homes in the area
Home Values in the Area
Average Home Value in this Area
Purchase History
| Date | Buyer | Sale Price | Title Company |
|---|---|---|---|
| Cuenca Hugo R | $430,000 | None Available | |
| Cuenca Hugo R | $430,000 | None Available | |
| Delrossi Dorothy A | -- | -- | |
| Delrossi Dorothy A | -- | -- |
Source: Public Records
Mortgage History
| Date | Status | Borrower | Loan Amount |
|---|---|---|---|
| Open | Cuenca Hugo R | $422,211 | |
| Closed | Cuenca Hugo R | $422,211 | |
| Previous Owner | Delrossi Dorothy A | $35,000 |
Source: Public Records
Tax History Compared to Growth
Tax History
| Year | Tax Paid | Tax Assessment Tax Assessment Total Assessment is a certain percentage of the fair market value that is determined by local assessors to be the total taxable value of land and additions on the property. | Land | Improvement |
|---|---|---|---|---|
| 2025 | $5,808 | $396,200 | $36,500 | $359,700 |
| 2024 | $4,714 | $308,900 | $30,400 | $278,500 |
| 2023 | $4,266 | $269,300 | $30,400 | $238,900 |
| 2022 | $4,033 | $225,300 | $26,000 | $199,300 |
| 2021 | $4,042 | $207,900 | $26,000 | $181,900 |
| 2020 | $3,808 | $195,500 | $26,000 | $169,500 |
| 2018 | $2,978 | $143,500 | $26,000 | $117,500 |
| 2017 | $2,952 | $143,500 | $26,000 | $117,500 |
| 2016 | $2,700 | $133,600 | $26,000 | $107,600 |
| 2015 | $2,592 | $127,300 | $26,000 | $101,300 |
| 2014 | $2,626 | $133,700 | $26,000 | $107,700 |
Source: Public Records
Map
Nearby Homes