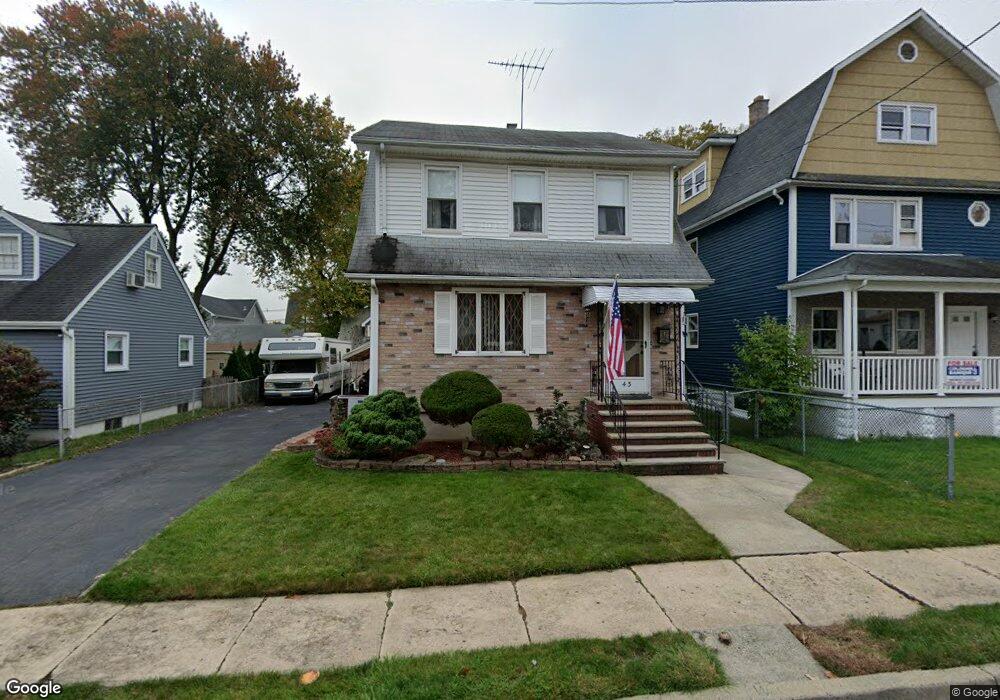
43 Chase St Nutley, NJ 07110
Estimated Value: $572,000 - $678,000
--
Bed
--
Bath
1,815
Sq Ft
$350/Sq Ft
Est. Value
About This Home
This home is located at 43 Chase St, Nutley, NJ 07110 and is currently estimated at $634,719, approximately $349 per square foot. 43 Chase St is a home located in Essex County with nearby schools including Nutley High School and Good Shepherd Academy.
Ownership History
Date
Name
Owned For
Owner Type
Purchase Details
Closed on
Jun 19, 2010
Sold by
Pfeifer John P
Bought by
Pfeifer John P
Current Estimated Value
Purchase Details
Closed on
Aug 15, 2007
Sold by
Pfeifer John P and Pfeifer Michele M
Bought by
Pfeifer John P
Purchase Details
Closed on
Jun 28, 1999
Sold by
Vitale John
Bought by
Pfeifer John and Pfeifer Michele
Home Financials for this Owner
Home Financials are based on the most recent Mortgage that was taken out on this home.
Original Mortgage
$185,500
Outstanding Balance
$52,330
Interest Rate
7.65%
Estimated Equity
$582,389
Create a Home Valuation Report for This Property
The Home Valuation Report is an in-depth analysis detailing your home's value as well as a comparison with similar homes in the area
Home Values in the Area
Average Home Value in this Area
Purchase History
| Date | Buyer | Sale Price | Title Company |
|---|---|---|---|
| Pfeifer John P | -- | None Available | |
| Pfeifer John P | -- | None Available | |
| Pfeifer John | $195,500 | -- |
Source: Public Records
Mortgage History
| Date | Status | Borrower | Loan Amount |
|---|---|---|---|
| Open | Pfeifer John | $185,500 |
Source: Public Records
Tax History Compared to Growth
Tax History
| Year | Tax Paid | Tax Assessment Tax Assessment Total Assessment is a certain percentage of the fair market value that is determined by local assessors to be the total taxable value of land and additions on the property. | Land | Improvement |
|---|---|---|---|---|
| 2025 | $10,853 | $421,300 | $185,700 | $235,600 |
| 2024 | $10,853 | $421,300 | $185,700 | $235,600 |
| 2022 | $9,622 | $250,300 | $95,700 | $154,600 |
| 2021 | $9,031 | $250,300 | $95,700 | $154,600 |
| 2020 | $9,216 | $250,300 | $95,700 | $154,600 |
| 2019 | $9,031 | $250,300 | $95,700 | $154,600 |
| 2018 | $8,788 | $250,300 | $95,700 | $154,600 |
| 2017 | $8,693 | $250,300 | $95,700 | $154,600 |
| 2016 | $8,435 | $250,300 | $95,700 | $154,600 |
| 2015 | $8,300 | $250,300 | $95,700 | $154,600 |
| 2014 | $8,195 | $250,300 | $95,700 | $154,600 |
Source: Public Records
Map
Nearby Homes
- 25 Woodland Ave
- 145 Harrison St
- 26 Donna Ct
- 28 Ackerman St
- 55 Florence St
- 52 Brookline Ave
- 55 Church St
- 153 Church St
- 20 Harrison St
- 170 Frank St
- 53 Passaic Ave
- 45 Rutan Rd
- 27 Passaic Ave Unit 2
- 18 Knox Place
- 83 Melwex St
- 108-110 Passaic Ave Unit B19
- 190 Conover Ave
- 108 Passaic Ave Unit B-19
- 453-455 Franklin Ave
- 12 Moore Place