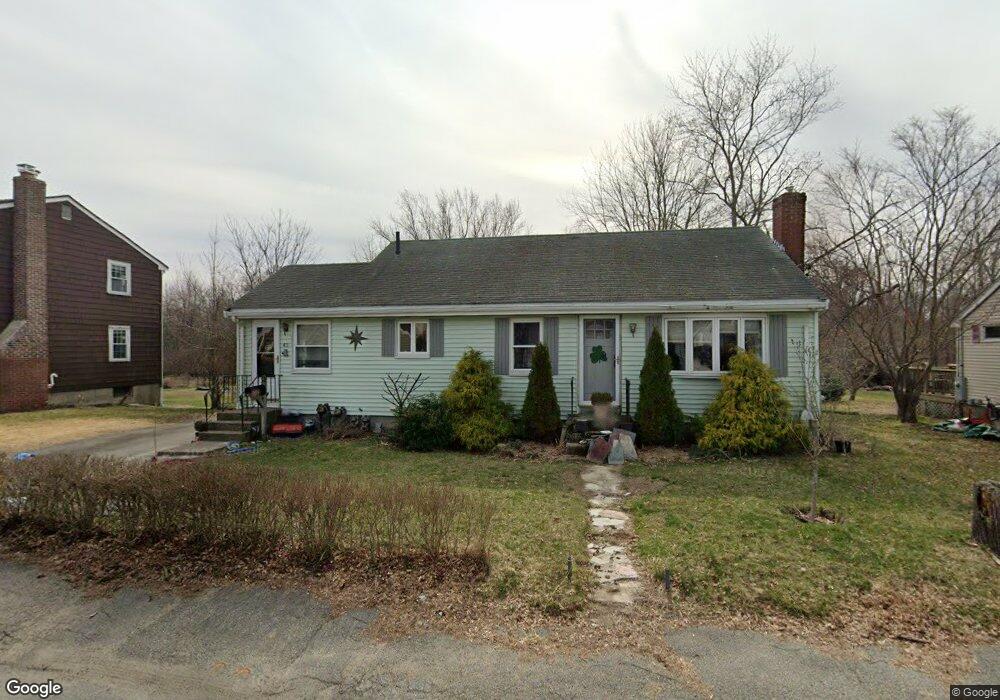
43 Chisholm Rd South Weymouth, MA 02190
Estimated Value: $463,000 - $595,000
--
Bed
1
Bath
1,045
Sq Ft
$521/Sq Ft
Est. Value
About This Home
This home is located at 43 Chisholm Rd, South Weymouth, MA 02190 and is currently estimated at $544,281, approximately $520 per square foot. 43 Chisholm Rd is a home located in Norfolk County with nearby schools including Ralph Talbot Primary School, Abigail Adams Middle School, and Weymouth Middle School Chapman.
Ownership History
Date
Name
Owned For
Owner Type
Purchase Details
Closed on
Jun 27, 2011
Sold by
Dilillo Ft
Bought by
Anderson Theodore M and Anderson Karen
Current Estimated Value
Home Financials for this Owner
Home Financials are based on the most recent Mortgage that was taken out on this home.
Original Mortgage
$209,000
Outstanding Balance
$144,598
Interest Rate
4.63%
Mortgage Type
Purchase Money Mortgage
Estimated Equity
$399,683
Create a Home Valuation Report for This Property
The Home Valuation Report is an in-depth analysis detailing your home's value as well as a comparison with similar homes in the area
Home Values in the Area
Average Home Value in this Area
Purchase History
| Date | Buyer | Sale Price | Title Company |
|---|---|---|---|
| Anderson Theodore M | $220,000 | -- |
Source: Public Records
Mortgage History
| Date | Status | Borrower | Loan Amount |
|---|---|---|---|
| Open | Anderson Theodore M | $209,000 |
Source: Public Records
Tax History Compared to Growth
Tax History
| Year | Tax Paid | Tax Assessment Tax Assessment Total Assessment is a certain percentage of the fair market value that is determined by local assessors to be the total taxable value of land and additions on the property. | Land | Improvement |
|---|---|---|---|---|
| 2025 | $4,857 | $480,900 | $237,300 | $243,600 |
| 2024 | $4,795 | $466,900 | $226,000 | $240,900 |
| 2023 | $4,718 | $451,500 | $228,300 | $223,200 |
| 2022 | $4,670 | $407,500 | $211,400 | $196,100 |
| 2021 | $4,384 | $373,400 | $211,400 | $162,000 |
| 2020 | $4,170 | $349,800 | $211,400 | $138,400 |
| 2019 | $4,004 | $330,400 | $203,300 | $127,100 |
| 2018 | $3,940 | $315,200 | $193,600 | $121,600 |
| 2017 | $3,847 | $300,300 | $184,400 | $115,900 |
| 2016 | $3,695 | $288,700 | $177,300 | $111,400 |
| 2015 | $3,595 | $278,700 | $177,300 | $101,400 |
| 2014 | $3,518 | $264,500 | $165,000 | $99,500 |
Source: Public Records
Map
Nearby Homes
- 17 Sears Rd
- 45 Cherry Ln
- 5 Oak St
- 41 Oak St
- 206 Pine St
- 26 Leahaven Rd
- 11 White St
- 261 Pleasant St Unit 5
- 120 Burkhall St Unit K
- 17 Buchanan Ln
- 159 Tall Oaks Dr Unit D
- 121 Tall Oaks Dr Unit Q
- 45 Union St
- 200 Burkhall St Unit 803
- 200 Burkhall St Unit 103
- 32 Weaver Rd
- 197 White St
- 27 Park Ave
- 54 Old Quarry Dr
- 740-742 Main St