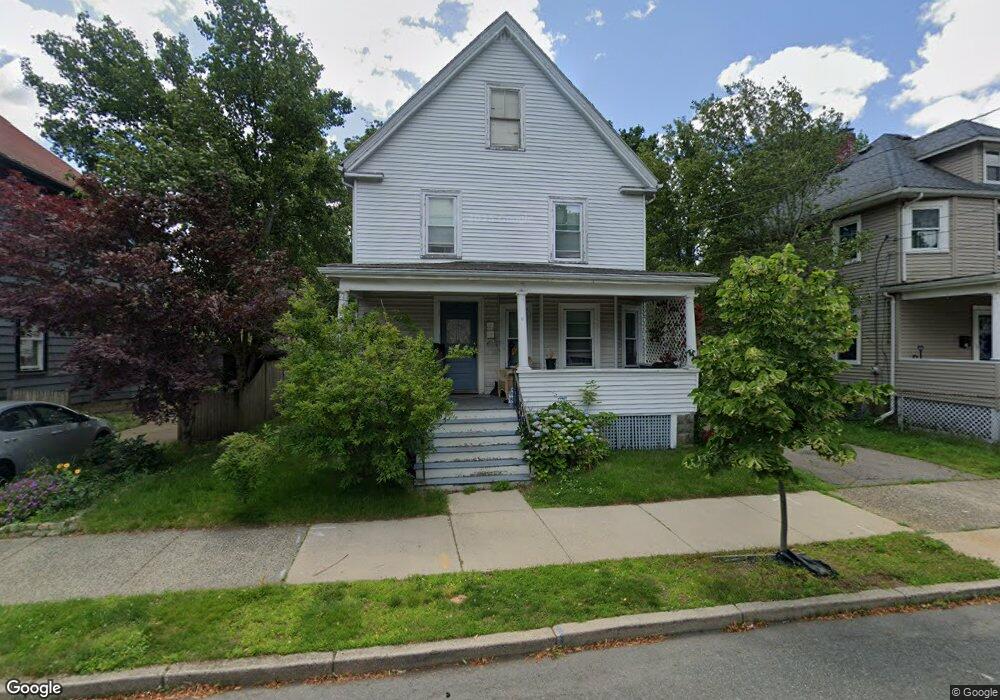
43 Clark St Lynn, MA 01902
Eastern Avenue NeighborhoodEstimated Value: $573,728 - $634,000
3
Beds
1
Bath
1,573
Sq Ft
$384/Sq Ft
Est. Value
About This Home
This home is located at 43 Clark St, Lynn, MA 01902 and is currently estimated at $603,682, approximately $383 per square foot. 43 Clark St is a home located in Essex County with nearby schools including Aborn Elementary School, William R. Fallon School, and Marshall Middle School.
Ownership History
Date
Name
Owned For
Owner Type
Purchase Details
Closed on
Mar 30, 2001
Sold by
Agnes E Berger Trust and Berger Stanley C
Bought by
Walker Susan and Walker Kevin M
Current Estimated Value
Home Financials for this Owner
Home Financials are based on the most recent Mortgage that was taken out on this home.
Original Mortgage
$175,800
Outstanding Balance
$62,931
Interest Rate
6.96%
Mortgage Type
Purchase Money Mortgage
Estimated Equity
$540,751
Purchase Details
Closed on
Dec 13, 1999
Sold by
Frisone Donald V Est and Grigg
Bought by
Connick James E
Create a Home Valuation Report for This Property
The Home Valuation Report is an in-depth analysis detailing your home's value as well as a comparison with similar homes in the area
Home Values in the Area
Average Home Value in this Area
Purchase History
| Date | Buyer | Sale Price | Title Company |
|---|---|---|---|
| Walker Susan | $192,500 | -- | |
| Walker Susan | $192,500 | -- | |
| Connick James E | $90,000 | -- | |
| Connick James E | $90,000 | -- |
Source: Public Records
Mortgage History
| Date | Status | Borrower | Loan Amount |
|---|---|---|---|
| Open | Connick James E | $175,800 | |
| Closed | Connick James E | $175,800 |
Source: Public Records
Tax History
| Year | Tax Paid | Tax Assessment Tax Assessment Total Assessment is a certain percentage of the fair market value that is determined by local assessors to be the total taxable value of land and additions on the property. | Land | Improvement |
|---|---|---|---|---|
| 2025 | $5,383 | $519,600 | $210,300 | $309,300 |
| 2024 | $5,011 | $475,900 | $197,700 | $278,200 |
| 2023 | $4,894 | $438,900 | $195,000 | $243,900 |
| 2022 | $4,645 | $373,700 | $156,900 | $216,800 |
| 2021 | $4,194 | $321,900 | $132,700 | $189,200 |
| 2020 | $4,161 | $310,500 | $129,600 | $180,900 |
| 2019 | $4,130 | $288,800 | $121,100 | $167,700 |
| 2018 | $4,180 | $275,900 | $130,500 | $145,400 |
| 2017 | $3,822 | $245,000 | $107,600 | $137,400 |
| 2016 | $3,835 | $237,000 | $108,000 | $129,000 |
| 2015 | $3,760 | $224,500 | $108,000 | $116,500 |
Source: Public Records
Map
Nearby Homes
- 16 Isabella St
- 21 E Park Ave
- 129 Marianna St
- 50 Webster St
- 91 Oakwood Ave
- 16 Clinton St
- 30 Clifton Ave
- 60 Roy St
- 11 Birch St
- 48 Clarendon Ave
- 106 Williams Ave
- 4 Valley Rd Unit 4
- 162 Chatham St
- 17 Marianna St
- 129 Williams Ave
- 431-433 Chatham St
- 80 Collins St
- 6A Goodridge St
- 238 Essex St
- 80 Norfolk Ave Unit 1
Your Personal Tour Guide
Ask me questions while you tour the home.