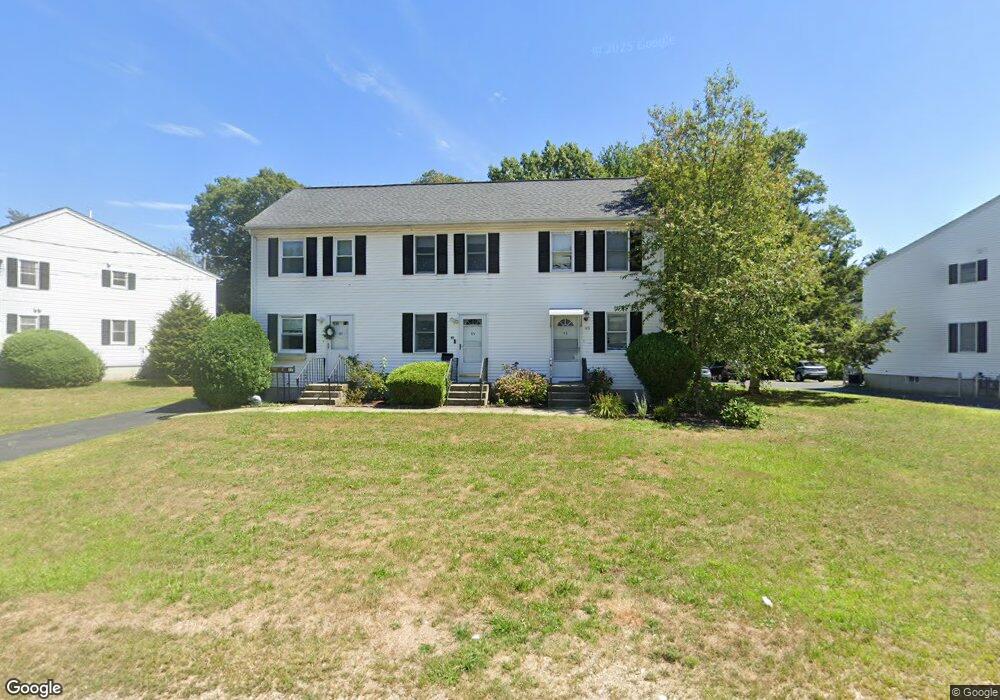
43 Colonel Bell Dr Brockton, MA 02301
Estimated Value: $284,000 - $357,000
2
Beds
2
Baths
1,494
Sq Ft
$218/Sq Ft
Est. Value
About This Home
This home is located at 43 Colonel Bell Dr, Brockton, MA 02301 and is currently estimated at $325,536, approximately $217 per square foot. 43 Colonel Bell Dr is a home located in Plymouth County with nearby schools including Manthala George Jr. School, Raymond K-8 Elementary School, and Louis F Angelo Elementary School.
Ownership History
Date
Name
Owned For
Owner Type
Purchase Details
Closed on
Aug 31, 2017
Sold by
Zhuang Daniel D and Zhuang-Deng Feng D
Bought by
Ndungu Lydiah W
Current Estimated Value
Home Financials for this Owner
Home Financials are based on the most recent Mortgage that was taken out on this home.
Original Mortgage
$145,500
Outstanding Balance
$121,698
Interest Rate
3.96%
Mortgage Type
New Conventional
Estimated Equity
$203,838
Purchase Details
Closed on
Feb 24, 2000
Sold by
43 Colonel Bell Dr T and Mahmood Aftab
Bought by
Zhuang Deng Feng D
Home Financials for this Owner
Home Financials are based on the most recent Mortgage that was taken out on this home.
Original Mortgage
$72,200
Interest Rate
8.15%
Mortgage Type
Purchase Money Mortgage
Purchase Details
Closed on
Mar 24, 1994
Sold by
Fnma
Bought by
Mahmood Aftab and Mahmood Rabia
Purchase Details
Closed on
Oct 12, 1990
Sold by
Franklyn Rt
Bought by
Opoku Henry
Create a Home Valuation Report for This Property
The Home Valuation Report is an in-depth analysis detailing your home's value as well as a comparison with similar homes in the area
Home Values in the Area
Average Home Value in this Area
Purchase History
| Date | Buyer | Sale Price | Title Company |
|---|---|---|---|
| Ndungu Lydiah W | $150,000 | -- | |
| Zhuang Deng Feng D | $76,000 | -- | |
| Mahmood Aftab | $30,000 | -- | |
| Opoku Henry | $110,000 | -- |
Source: Public Records
Mortgage History
| Date | Status | Borrower | Loan Amount |
|---|---|---|---|
| Open | Ndungu Lydiah W | $145,500 | |
| Previous Owner | Opoku Henry | $140,000 | |
| Previous Owner | Opoku Henry | $90,000 | |
| Previous Owner | Opoku Henry | $72,200 |
Source: Public Records
Tax History Compared to Growth
Tax History
| Year | Tax Paid | Tax Assessment Tax Assessment Total Assessment is a certain percentage of the fair market value that is determined by local assessors to be the total taxable value of land and additions on the property. | Land | Improvement |
|---|---|---|---|---|
| 2025 | $3,617 | $298,700 | $0 | $298,700 |
| 2024 | $3,571 | $297,100 | $0 | $297,100 |
| 2023 | $3,111 | $239,700 | $0 | $239,700 |
| 2022 | $2,874 | $205,700 | $0 | $205,700 |
| 2021 | $2,651 | $182,800 | $0 | $182,800 |
| 2020 | $2,545 | $168,000 | $0 | $168,000 |
| 2019 | $2,277 | $146,500 | $0 | $146,500 |
| 2018 | $2,056 | $128,000 | $0 | $128,000 |
| 2017 | $1,967 | $122,200 | $0 | $122,200 |
| 2016 | $2,238 | $128,920 | $0 | $128,920 |
| 2015 | $2,024 | $111,490 | $0 | $111,490 |
| 2014 | $1,922 | $106,020 | $0 | $106,020 |
Source: Public Records
Map
Nearby Homes
- 77 Colonel Bell Dr Unit 4
- 20 Montauk Rd
- 21 Oneida Ave
- 17 Moraine Place
- 61 Fairfield St
- 114 Crickett Rd
- 68 Cross St
- 302 Prospect St
- 45 Cross St
- 141 Prospect Ave
- 25 Monson St
- 96 Coventry Cir
- 37 West St
- 7 N Winnifred Rd
- 72 Kurland Ave
- 22 Trudy Terrace
- 194 Prospect St
- 34 Eaton St
- 281 Spring St
- 161 Moraine St
- 43 Colonel Bell Dr Unit 43
- 47 Colonel Bell Dr
- 43 Colonel Bell Dr Unit 1
- 45 Colonel Bell Dr
- 37 Colonel Bell Dr
- 37 Colonel Bell Dr Unit 37
- 37 Colonel Bell Dr Unit A3
- 55 Colonel Bell Dr
- 53 Colonel Bell Dr
- 55 Colonel Bell Dr Unit 55
- 33 Colonel Bell Dr
- 33 Colonel Bell Dr Unit 1A,33
- 35 Colonel Bell Dr
- 35 Colonel Bell Dr Unit 35
- 57 Colonel Bell Dr
- 52 Colonel Bell Dr
- 50 Colonel Bell Dr
- 48 Colonel Bell Dr
- 50 Colonel Bell Dr Unit 50
- 94 Belair St