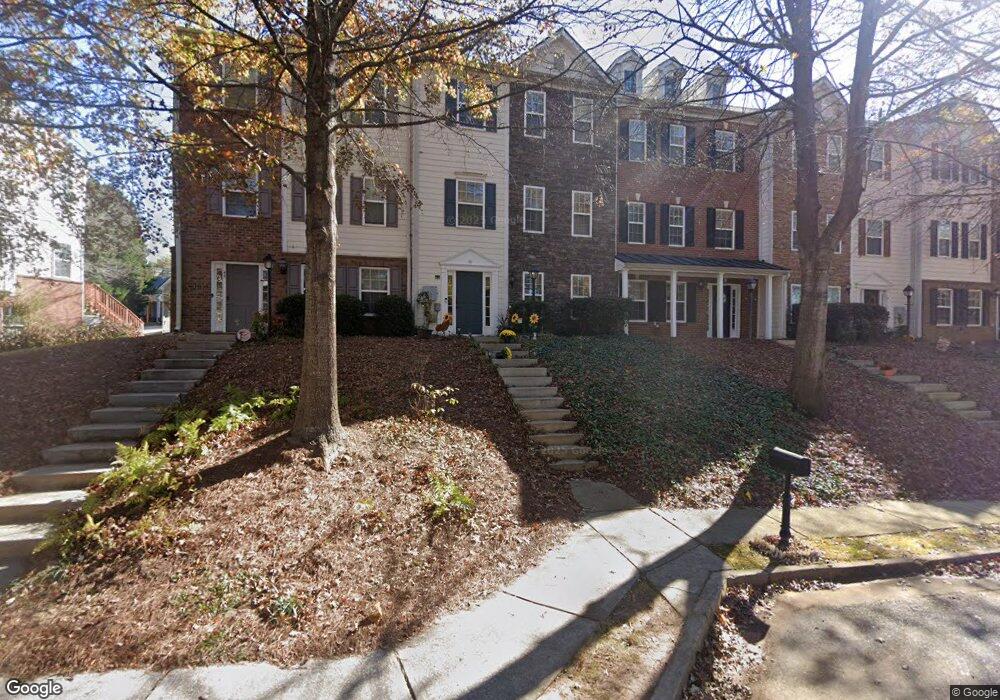
43 Corbel Way Newnan, GA 30265
Summergrove NeighborhoodEstimated Value: $288,000 - $304,000
3
Beds
4
Baths
1,420
Sq Ft
$209/Sq Ft
Est. Value
About This Home
This home is located at 43 Corbel Way, Newnan, GA 30265 and is currently estimated at $296,457, approximately $208 per square foot. 43 Corbel Way is a home located in Coweta County with nearby schools including Welch Elementary School, Lee Middle School, and East Coweta High School.
Ownership History
Date
Name
Owned For
Owner Type
Purchase Details
Closed on
Apr 25, 2014
Sold by
Melton Bryan J
Bought by
Del-Valle Maria M
Current Estimated Value
Home Financials for this Owner
Home Financials are based on the most recent Mortgage that was taken out on this home.
Original Mortgage
$102,800
Outstanding Balance
$78,184
Interest Rate
4.43%
Mortgage Type
New Conventional
Estimated Equity
$218,273
Purchase Details
Closed on
Mar 3, 2008
Sold by
Homeland Legacy Builders
Bought by
Melton Bryan J
Home Financials for this Owner
Home Financials are based on the most recent Mortgage that was taken out on this home.
Original Mortgage
$141,050
Interest Rate
5.46%
Mortgage Type
FHA
Purchase Details
Closed on
Jan 20, 2003
Sold by
Hyland Developers Inc
Bought by
Homeland Legacy Inc
Purchase Details
Closed on
Dec 28, 2000
Bought by
Hyland Developers Inc
Create a Home Valuation Report for This Property
The Home Valuation Report is an in-depth analysis detailing your home's value as well as a comparison with similar homes in the area
Home Values in the Area
Average Home Value in this Area
Purchase History
| Date | Buyer | Sale Price | Title Company |
|---|---|---|---|
| Del-Valle Maria M | $128,500 | -- | |
| Melton Bryan J | $143,400 | -- | |
| Homeland Legacy Inc | $1,025,000 | -- | |
| Hyland Developers Inc | $798,100 | -- |
Source: Public Records
Mortgage History
| Date | Status | Borrower | Loan Amount |
|---|---|---|---|
| Open | Del-Valle Maria M | $102,800 | |
| Previous Owner | Melton Bryan J | $141,050 |
Source: Public Records
Tax History Compared to Growth
Tax History
| Year | Tax Paid | Tax Assessment Tax Assessment Total Assessment is a certain percentage of the fair market value that is determined by local assessors to be the total taxable value of land and additions on the property. | Land | Improvement |
|---|---|---|---|---|
| 2025 | $1,439 | $99,842 | $22,000 | $77,842 |
| 2024 | $1,362 | $102,126 | $22,000 | $80,126 |
| 2023 | $1,362 | $84,744 | $22,000 | $62,744 |
| 2022 | $969 | $81,461 | $22,000 | $59,461 |
| 2021 | $697 | $66,478 | $18,000 | $48,478 |
| 2020 | $724 | $66,478 | $18,000 | $48,478 |
| 2019 | $1,761 | $62,357 | $10,000 | $52,357 |
| 2018 | $1,771 | $62,357 | $10,000 | $52,357 |
| 2017 | $1,564 | $55,764 | $10,000 | $45,764 |
| 2016 | $1,532 | $54,600 | $10,000 | $44,600 |
| 2015 | $1,418 | $50,722 | $10,000 | $40,722 |
| 2014 | $1,229 | $42,965 | $10,000 | $32,965 |
Source: Public Records
Map
Nearby Homes
- 41 Corbel Way
- 111 Portico Place
- 7 High Point Cir
- 173 Freeman Forest Dr
- 70 High Point North Dr
- 425 Lake Forest Dr
- 15 Oak Shores Dr
- 30 Oak Shores Dr
- 2589 Lower Fayetteville Rd
- 306 Freeman Forest Dr
- 6 Scenic Hills Dr
- 185 Pine Crescent
- 147 Lake Cove Approach
- 21 Oak Park Square
- 31 The Promenade
- 24 Brookview Dr
- 14 Avondale Cir
- 41 Briar Grove
- 43 Beacon Crest
- 64 Gables Way
- 41 Corbel Way Unit 64A
- 39 Corbel Way Unit 42
- 39 Corbel Way
- 49 Corbel Way
- 37 Corbel Way
- 51 Corbel Way
- 45 High Point Cir
- 45 Corbel Way
- 31 Corbel Way
- 53 Corbel Way
- 41 High Point Cir
- 42 Corbel Way
- 44 Corbel Way
- 55 Corbel Way
- 46 Corbel Way
- 29 Corbel Way
- 49 High Point Cir
- 48 Corbel Way
- 57 Corbel Way
- 50 Corbel Way