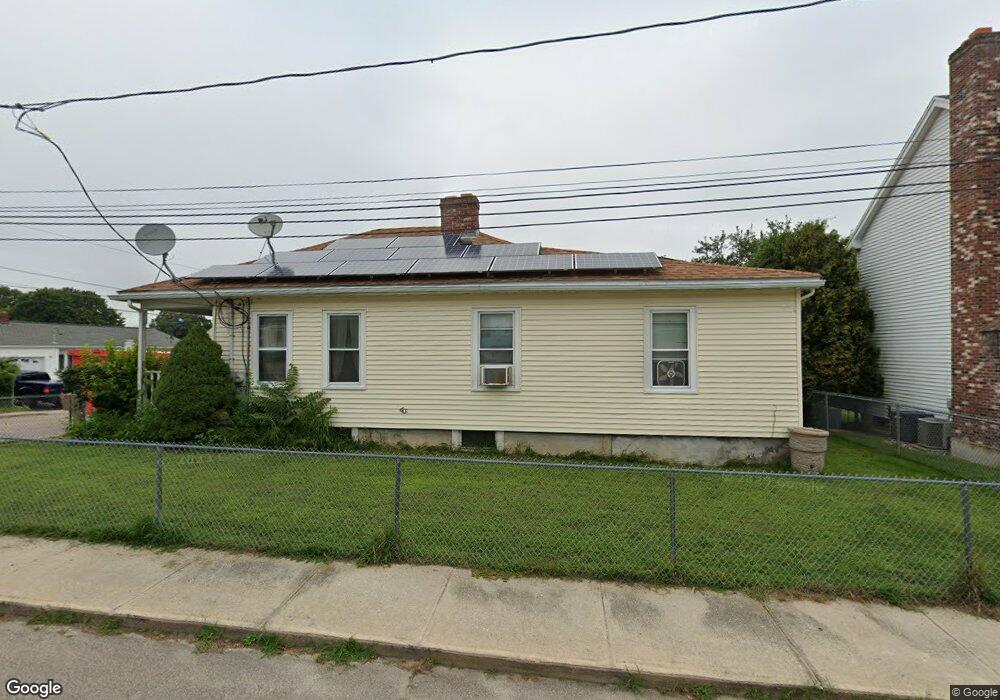
43 County St Blackstone, MA 01504
Estimated Value: $372,000 - $439,000
3
Beds
1
Bath
1,099
Sq Ft
$371/Sq Ft
Est. Value
About This Home
This home is located at 43 County St, Blackstone, MA 01504 and is currently estimated at $408,056, approximately $371 per square foot. 43 County St is a home located in Worcester County with nearby schools including Blackstone-Millville Regional High School, Founders Academy, and Beacon Charter School.
Ownership History
Date
Name
Owned For
Owner Type
Purchase Details
Closed on
Sep 18, 2007
Sold by
Moran Scott
Bought by
Moran Ellen and Moran Scott
Current Estimated Value
Purchase Details
Closed on
Nov 17, 2006
Sold by
Country Home Bldrs Inc
Bought by
Moran Scott
Purchase Details
Closed on
Mar 31, 2005
Sold by
Murphy Kelly A and Roe Kelly A
Bought by
Country Home Bldrs Inc
Purchase Details
Closed on
Jul 26, 2001
Sold by
Department Of Housing & Urban Dev
Bought by
Murphy Kelly A and Roe Robert M
Purchase Details
Closed on
Dec 4, 2000
Sold by
Morin Albert E
Bought by
Chase Manhattan Mtg
Purchase Details
Closed on
Oct 20, 1998
Sold by
Makowski Doris L
Bought by
Morin Albert E and Morin Doreen M
Purchase Details
Closed on
Oct 13, 1992
Sold by
Makowski John T
Bought by
Makowski Doris L
Create a Home Valuation Report for This Property
The Home Valuation Report is an in-depth analysis detailing your home's value as well as a comparison with similar homes in the area
Home Values in the Area
Average Home Value in this Area
Purchase History
| Date | Buyer | Sale Price | Title Company |
|---|---|---|---|
| Moran Ellen | -- | -- | |
| Moran Scott | $217,500 | -- | |
| Country Home Bldrs Inc | $264,900 | -- | |
| Murphy Kelly A | $115,000 | -- | |
| Chase Manhattan Mtg | $131,406 | -- | |
| Morin Albert E | $119,359 | -- | |
| Makowski Doris L | $18,000 | -- |
Source: Public Records
Mortgage History
| Date | Status | Borrower | Loan Amount |
|---|---|---|---|
| Open | Makowski Doris L | $220,557 | |
| Closed | Makowski Doris L | $223,009 |
Source: Public Records
Tax History Compared to Growth
Tax History
| Year | Tax Paid | Tax Assessment Tax Assessment Total Assessment is a certain percentage of the fair market value that is determined by local assessors to be the total taxable value of land and additions on the property. | Land | Improvement |
|---|---|---|---|---|
| 2025 | $4,645 | $307,600 | $99,000 | $208,600 |
| 2024 | $4,636 | $283,900 | $99,000 | $184,900 |
| 2023 | $4,168 | $257,600 | $99,000 | $158,600 |
| 2022 | $4,303 | $240,400 | $94,700 | $145,700 |
| 2021 | $3,815 | $203,800 | $86,100 | $117,700 |
| 2020 | $3,683 | $195,300 | $86,100 | $109,200 |
| 2019 | $4,305 | $185,900 | $79,200 | $106,700 |
| 2018 | $12,152 | $166,500 | $75,400 | $91,100 |
| 2017 | $2,777 | $144,200 | $75,400 | $68,800 |
| 2016 | $2,495 | $129,000 | $67,200 | $61,800 |
| 2015 | $2,392 | $122,800 | $67,200 | $55,600 |
Source: Public Records
Map
Nearby Homes
- 259 Main St
- 1 Tupperware Dr Unit 226
- 1 Tupperware Dr Unit 138
- 1 Tupperware Dr Unit 108
- 0 Main St
- 225-227 Main St
- 6 Old Mendon St
- 8 Old Mendon St Unit 8
- 122 Canal St
- 175 Saint Paul St
- 22 Colerick Ave
- 81 Fountain St
- 12 Keough St
- 470 Saint Paul St
- 96 Main St Unit 1
- 29 Graves Ave
- 24 Reilly Ave
- 4 Sharon Pkwy
- 15 Blackstone St
- 5 Lincoln Dr