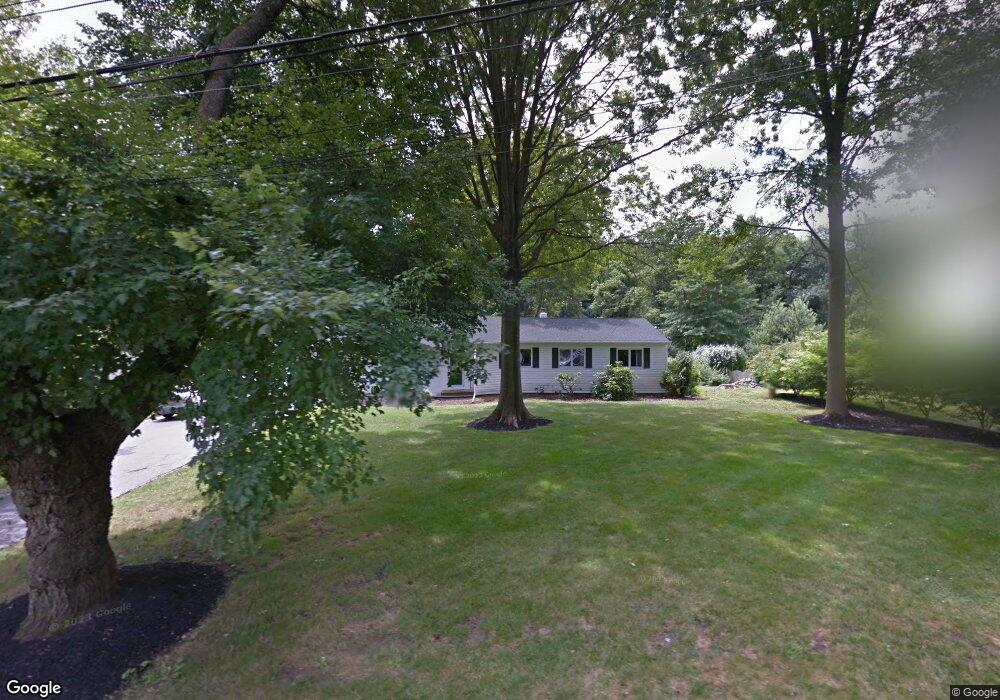
43 Devon Ct Tinton Falls, NJ 07724
Estimated Value: $771,918 - $858,000
4
Beds
2
Baths
1,842
Sq Ft
$445/Sq Ft
Est. Value
About This Home
This home is located at 43 Devon Ct, Tinton Falls, NJ 07724 and is currently estimated at $819,730, approximately $445 per square foot. 43 Devon Ct is a home located in Monmouth County with nearby schools including Mahala F. Atchinson Elementary School, Swimming River Elementary School, and Tinton Falls Middle School.
Ownership History
Date
Name
Owned For
Owner Type
Purchase Details
Closed on
Jul 16, 2009
Sold by
Miller Theresa R
Bought by
Koch Robert and Koch Renee
Current Estimated Value
Home Financials for this Owner
Home Financials are based on the most recent Mortgage that was taken out on this home.
Original Mortgage
$346,967
Outstanding Balance
$229,540
Interest Rate
5.58%
Mortgage Type
FHA
Estimated Equity
$590,190
Purchase Details
Closed on
May 18, 1999
Sold by
Ochs Elbert
Bought by
Miller Theresa
Home Financials for this Owner
Home Financials are based on the most recent Mortgage that was taken out on this home.
Original Mortgage
$180,700
Interest Rate
7.09%
Create a Home Valuation Report for This Property
The Home Valuation Report is an in-depth analysis detailing your home's value as well as a comparison with similar homes in the area
Home Values in the Area
Average Home Value in this Area
Purchase History
| Date | Buyer | Sale Price | Title Company |
|---|---|---|---|
| Koch Robert | $401,500 | Chicago Title Insurance Co | |
| Miller Theresa | $225,900 | -- |
Source: Public Records
Mortgage History
| Date | Status | Borrower | Loan Amount |
|---|---|---|---|
| Open | Koch Robert | $346,967 | |
| Previous Owner | Miller Theresa | $180,700 |
Source: Public Records
Tax History
| Year | Tax Paid | Tax Assessment Tax Assessment Total Assessment is a certain percentage of the fair market value that is determined by local assessors to be the total taxable value of land and additions on the property. | Land | Improvement |
|---|---|---|---|---|
| 2025 | $9,102 | $634,000 | $370,600 | $263,400 |
| 2024 | $8,722 | $626,000 | $351,800 | $274,200 |
| 2023 | $8,722 | $567,100 | $298,100 | $269,000 |
| 2022 | $8,281 | $497,400 | $241,300 | $256,100 |
| 2021 | $7,898 | $427,500 | $227,500 | $200,000 |
| 2020 | $8,118 | $404,900 | $209,400 | $195,500 |
| 2019 | $7,898 | $394,900 | $202,500 | $192,400 |
| 2018 | $7,840 | $391,200 | $219,700 | $171,500 |
| 2017 | $8,037 | $391,300 | $225,000 | $166,300 |
| 2016 | $8,608 | $410,300 | $236,900 | $173,400 |
| 2015 | $8,532 | $411,400 | $268,800 | $142,600 |
| 2014 | $7,176 | $330,100 | $174,700 | $155,400 |
Source: Public Records
Map
Nearby Homes
Your Personal Tour Guide
Ask me questions while you tour the home.