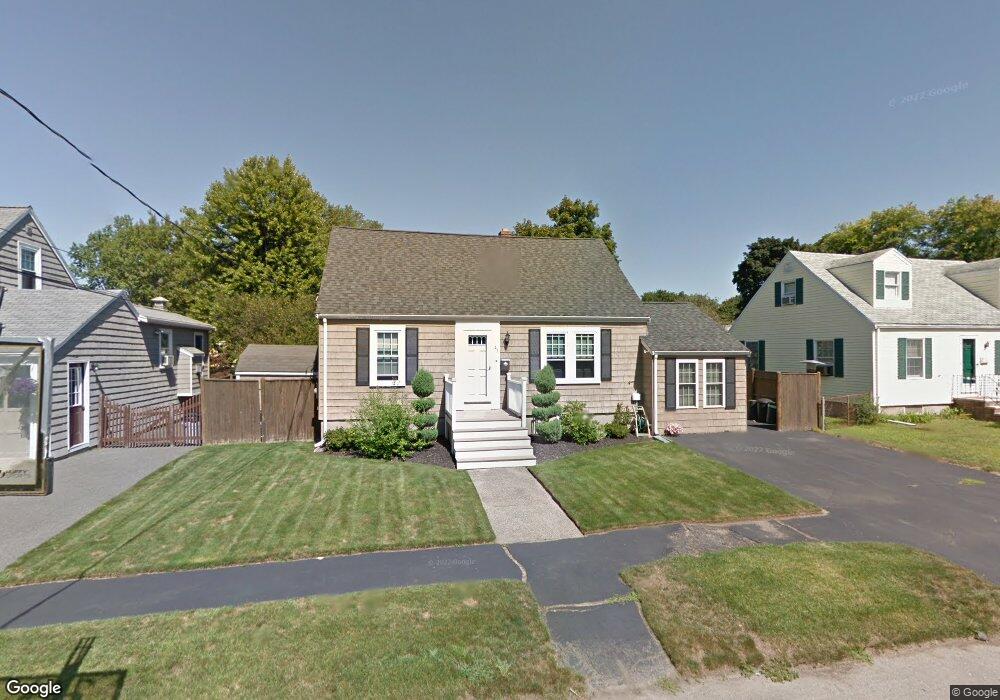
43 Dexter St Peabody, MA 01960
South Peabody NeighborhoodEstimated Value: $654,000 - $751,000
3
Beds
2
Baths
1,737
Sq Ft
$401/Sq Ft
Est. Value
About This Home
This home is located at 43 Dexter St, Peabody, MA 01960 and is currently estimated at $695,727, approximately $400 per square foot. 43 Dexter St is a home located in Essex County with nearby schools including Peabody Veterans Memorial High School, North Shore Christian School, and St John The Baptist School.
Ownership History
Date
Name
Owned For
Owner Type
Purchase Details
Closed on
Nov 8, 1999
Sold by
Mclaughlin Merry C and Nordeen Marry C
Bought by
Dicampo Dena and Browne Keith M
Current Estimated Value
Purchase Details
Closed on
Nov 27, 1991
Sold by
Fowler Albert D and Vermilyea James
Bought by
Mclaughlin Wayne and Mclaughlin Merry C
Purchase Details
Closed on
Aug 21, 1987
Sold by
Bailey Charles B
Bought by
Fowler Albert D
Create a Home Valuation Report for This Property
The Home Valuation Report is an in-depth analysis detailing your home's value as well as a comparison with similar homes in the area
Home Values in the Area
Average Home Value in this Area
Purchase History
| Date | Buyer | Sale Price | Title Company |
|---|---|---|---|
| Dicampo Dena | $225,000 | -- | |
| Mclaughlin Wayne | $156,000 | -- | |
| Fowler Albert D | $152,500 | -- |
Source: Public Records
Mortgage History
| Date | Status | Borrower | Loan Amount |
|---|---|---|---|
| Open | Fowler Albert D | $80,000 | |
| Open | Fowler Albert D | $180,000 | |
| Closed | Fowler Albert D | $180,000 |
Source: Public Records
Tax History Compared to Growth
Tax History
| Year | Tax Paid | Tax Assessment Tax Assessment Total Assessment is a certain percentage of the fair market value that is determined by local assessors to be the total taxable value of land and additions on the property. | Land | Improvement |
|---|---|---|---|---|
| 2025 | $5,795 | $625,800 | $232,600 | $393,200 |
| 2024 | $5,269 | $577,700 | $232,600 | $345,100 |
| 2023 | $5,107 | $536,400 | $207,700 | $328,700 |
| 2022 | $4,902 | $485,300 | $185,500 | $299,800 |
| 2021 | $4,596 | $438,100 | $168,600 | $269,500 |
| 2020 | $4,615 | $429,700 | $168,600 | $261,100 |
| 2019 | $4,468 | $405,800 | $168,600 | $237,200 |
| 2018 | $4,382 | $382,400 | $153,300 | $229,100 |
| 2017 | $4,218 | $358,700 | $153,300 | $205,400 |
| 2016 | $4,030 | $338,100 | $153,300 | $184,800 |
| 2015 | $3,681 | $299,300 | $149,500 | $149,800 |
Source: Public Records
Map
Nearby Homes
- 41 Dexter St
- 6 Christopher Terrace
- 5 Quarry Terrace
- 106 Lynnfield St
- 5 Louis Rd
- 3 Veterans Memorial Dr
- 60 Lynn St
- 17 Janet Ln
- 29 Rockway Rd
- 232 Lynn St
- 43 Gedney Dr
- 34 Glendale Ave
- 131 Den Quarry Rd
- 35 Oak Ridge Cir
- 69 Saunders Rd
- 85 Range Ave
- 325 Den Quarry Rd
- 217 Cedar Brook Rd
- 18 Woodrow Terrace
- 16 Sarah's Way