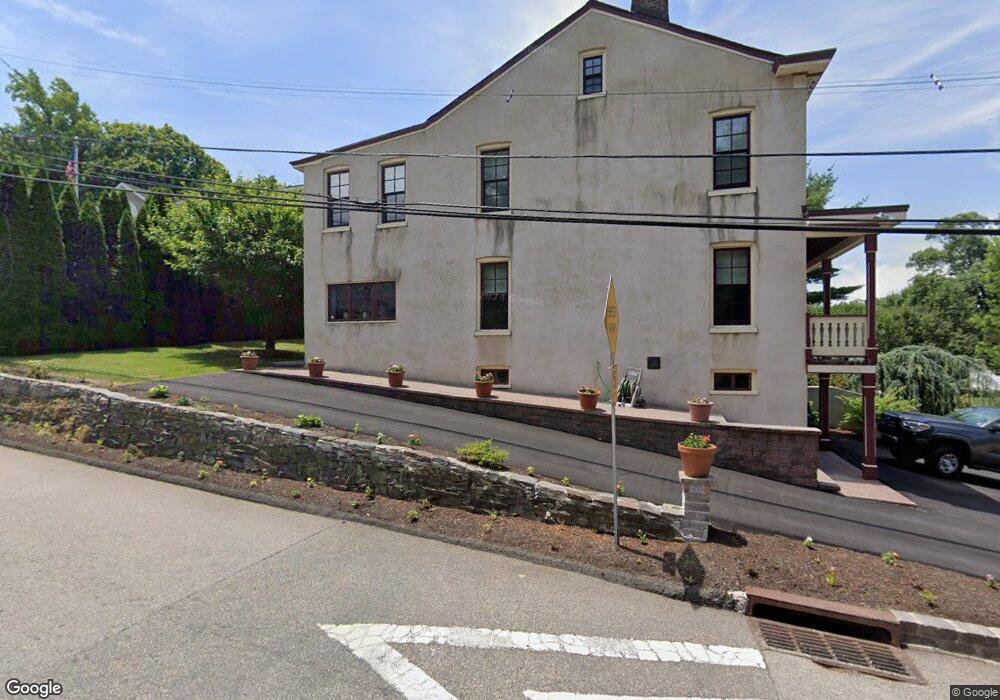
43 Douglas St Lambertville, NJ 08530
Estimated Value: $493,157 - $548,000
--
Bed
--
Bath
1,560
Sq Ft
$331/Sq Ft
Est. Value
About This Home
This home is located at 43 Douglas St, Lambertville, NJ 08530 and is currently estimated at $516,539, approximately $331 per square foot. 43 Douglas St is a home located in Hunterdon County with nearby schools including South Hunterdon Regional Elementary School, South Hunterdon High School, and The Jesus School.
Ownership History
Date
Name
Owned For
Owner Type
Purchase Details
Closed on
Jun 21, 2013
Sold by
Peluso Mario
Bought by
Peluso Mario and Jerez Isela Beatriz Rivera
Current Estimated Value
Purchase Details
Closed on
May 31, 2005
Sold by
Peluso Mario
Bought by
Peluso Mario
Purchase Details
Closed on
May 30, 1997
Sold by
Hartpence Harry C
Bought by
Peluso Mario
Home Financials for this Owner
Home Financials are based on the most recent Mortgage that was taken out on this home.
Original Mortgage
$96,000
Outstanding Balance
$13,596
Interest Rate
7.86%
Estimated Equity
$502,943
Create a Home Valuation Report for This Property
The Home Valuation Report is an in-depth analysis detailing your home's value as well as a comparison with similar homes in the area
Home Values in the Area
Average Home Value in this Area
Purchase History
| Date | Buyer | Sale Price | Title Company |
|---|---|---|---|
| Peluso Mario | -- | None Available | |
| Peluso Mario | -- | -- | |
| Peluso Mario | -- | -- | |
| Peluso Mario | $106,000 | -- |
Source: Public Records
Mortgage History
| Date | Status | Borrower | Loan Amount |
|---|---|---|---|
| Open | Peluso Mario | $96,000 |
Source: Public Records
Tax History Compared to Growth
Tax History
| Year | Tax Paid | Tax Assessment Tax Assessment Total Assessment is a certain percentage of the fair market value that is determined by local assessors to be the total taxable value of land and additions on the property. | Land | Improvement |
|---|---|---|---|---|
| 2025 | $9,415 | $420,100 | $264,500 | $155,600 |
| 2024 | $9,160 | $407,400 | $254,500 | $152,900 |
| 2023 | $9,160 | $391,100 | $239,500 | $151,600 |
| 2022 | $8,803 | $381,100 | $229,500 | $151,600 |
| 2021 | $7,856 | $371,100 | $219,500 | $151,600 |
| 2020 | $8,242 | $371,100 | $219,500 | $151,600 |
| 2019 | $7,856 | $371,100 | $219,500 | $151,600 |
| 2018 | $7,633 | $366,100 | $214,500 | $151,600 |
| 2017 | $7,370 | $361,100 | $209,500 | $151,600 |
| 2016 | $7,126 | $356,100 | $204,500 | $151,600 |
| 2015 | $6,953 | $344,700 | $194,500 | $150,200 |
| 2014 | $6,870 | $344,700 | $194,500 | $150,200 |
Source: Public Records
Map
Nearby Homes