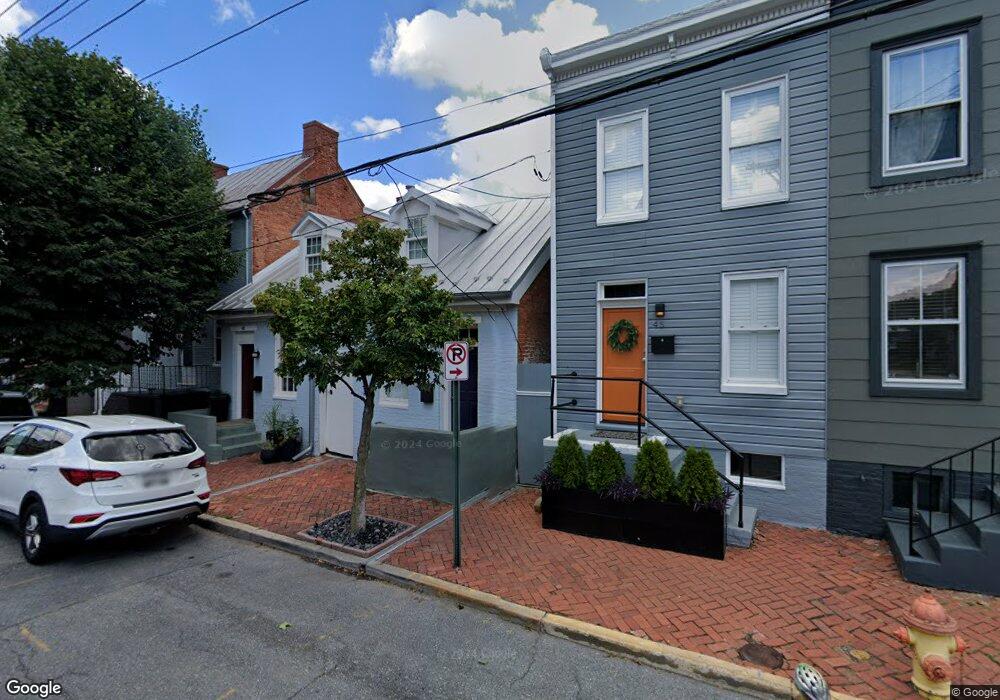
43 E 5th St Frederick, MD 21701
Downtown Frederick NeighborhoodEstimated Value: $263,000 - $364,000
1
Bed
1
Bath
711
Sq Ft
$430/Sq Ft
Est. Value
About This Home
This home is located at 43 E 5th St, Frederick, MD 21701 and is currently estimated at $305,639, approximately $429 per square foot. 43 E 5th St is a home located in Frederick County with nearby schools including Spring Ridge Elementary School, Gov. Thomas Johnson Middle School, and Gov. Thomas Johnson High School.
Ownership History
Date
Name
Owned For
Owner Type
Purchase Details
Closed on
May 17, 2019
Sold by
Butner Sarah T
Bought by
Sarah Thiel Butner Revocable Trust
Current Estimated Value
Purchase Details
Closed on
Jan 24, 2013
Sold by
Sappington Properties Llc
Bought by
Butner Sarah T
Home Financials for this Owner
Home Financials are based on the most recent Mortgage that was taken out on this home.
Original Mortgage
$54,000
Outstanding Balance
$24,362
Interest Rate
3.38%
Mortgage Type
New Conventional
Estimated Equity
$281,277
Purchase Details
Closed on
Aug 24, 2009
Sold by
Degrange Bernard Thomas
Bought by
Sappington Properties Llc
Purchase Details
Closed on
Oct 21, 2002
Sold by
Stitley Lois Irene and R For P
Bought by
Degrange Bernard Thomas
Create a Home Valuation Report for This Property
The Home Valuation Report is an in-depth analysis detailing your home's value as well as a comparison with similar homes in the area
Home Values in the Area
Average Home Value in this Area
Purchase History
| Date | Buyer | Sale Price | Title Company |
|---|---|---|---|
| Sarah Thiel Butner Revocable Trust | -- | None Available | |
| Butner Sarah T | $72,000 | New Horizon Title Inc | |
| Sappington Properties Llc | $45,000 | -- | |
| Degrange Bernard Thomas | -- | -- | |
| Stitley Lois Irene | -- | -- |
Source: Public Records
Mortgage History
| Date | Status | Borrower | Loan Amount |
|---|---|---|---|
| Open | Butner Sarah T | $54,000 | |
| Closed | Sappington Properties Llc | -- |
Source: Public Records
Tax History
| Year | Tax Paid | Tax Assessment Tax Assessment Total Assessment is a certain percentage of the fair market value that is determined by local assessors to be the total taxable value of land and additions on the property. | Land | Improvement |
|---|---|---|---|---|
| 2025 | $3,985 | $232,800 | $144,700 | $88,100 |
| 2024 | $3,985 | $212,633 | $0 | $0 |
| 2023 | $3,516 | $192,467 | $0 | $0 |
| 2022 | $3,145 | $172,300 | $101,800 | $70,500 |
| 2021 | $2,120 | $154,233 | $0 | $0 |
| 2020 | $1,512 | $136,167 | $0 | $0 |
| 2019 | $1,322 | $118,100 | $59,200 | $58,900 |
| 2018 | $1,602 | $102,700 | $0 | $0 |
| 2017 | $1,426 | $118,100 | $0 | $0 |
| 2016 | $2,025 | $71,900 | $0 | $0 |
| 2015 | $2,025 | $71,900 | $0 | $0 |
| 2014 | $2,025 | $71,900 | $0 | $0 |
Source: Public Records
Map
Nearby Homes
Your Personal Tour Guide
Ask me questions while you tour the home.