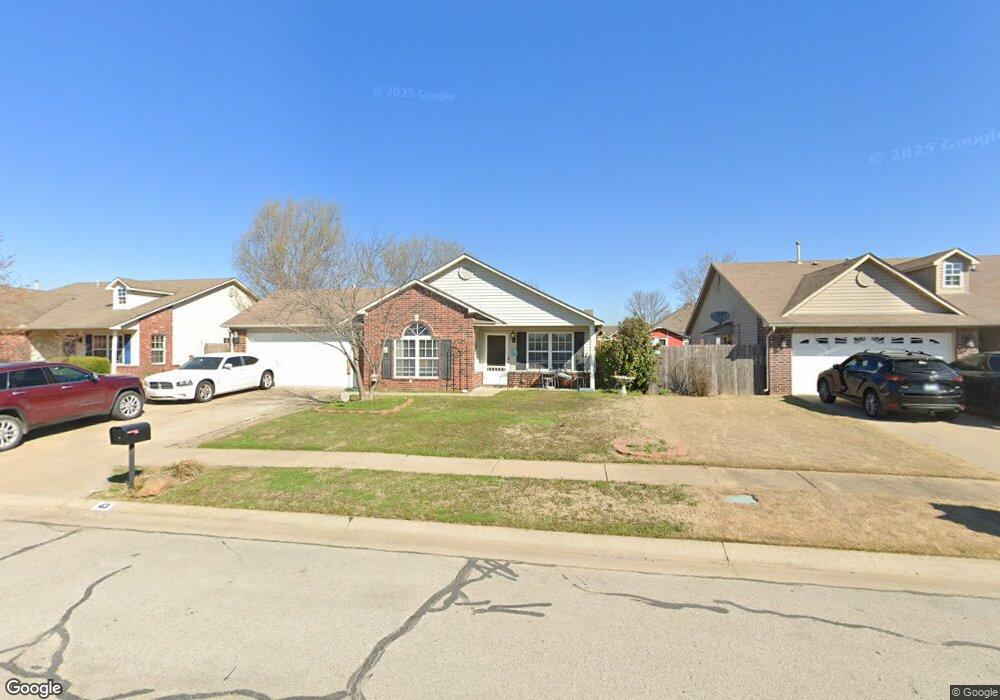
43 E Falcon Dr Sapulpa, OK 74066
Estimated Value: $200,361 - $226,000
3
Beds
2
Baths
1,433
Sq Ft
$153/Sq Ft
Est. Value
About This Home
This home is located at 43 E Falcon Dr, Sapulpa, OK 74066 and is currently estimated at $218,590, approximately $152 per square foot. 43 E Falcon Dr is a home located in Creek County with nearby schools including Lone Star Public School, Eagle Point Christian Academy, and American Christian Academy.
Ownership History
Date
Name
Owned For
Owner Type
Purchase Details
Closed on
Aug 18, 2023
Sold by
Oaks 282
Bought by
Mozingo John T and Mozingo Elizabeth A
Current Estimated Value
Purchase Details
Closed on
Feb 2, 2022
Sold by
Oaks 282
Bought by
Mozingo John T and Mozingo Elizabeth A
Purchase Details
Closed on
Dec 20, 2006
Sold by
Rausch Coleman Ss Llc
Bought by
Mozingo Elizabeth and Mozingo John
Home Financials for this Owner
Home Financials are based on the most recent Mortgage that was taken out on this home.
Original Mortgage
$112,840
Interest Rate
6.2%
Mortgage Type
New Conventional
Create a Home Valuation Report for This Property
The Home Valuation Report is an in-depth analysis detailing your home's value as well as a comparison with similar homes in the area
Home Values in the Area
Average Home Value in this Area
Purchase History
| Date | Buyer | Sale Price | Title Company |
|---|---|---|---|
| Mozingo John T | -- | None Listed On Document | |
| Mozingo John T | $61,500 | Fidelity National Title | |
| Mozingo Elizabeth | $113,000 | None Available | |
| Mozing Elizabeth | $113,000 | None Available |
Source: Public Records
Mortgage History
| Date | Status | Borrower | Loan Amount |
|---|---|---|---|
| Previous Owner | Mozing Elizabeth | $112,840 |
Source: Public Records
Tax History
| Year | Tax Paid | Tax Assessment Tax Assessment Total Assessment is a certain percentage of the fair market value that is determined by local assessors to be the total taxable value of land and additions on the property. | Land | Improvement |
|---|---|---|---|---|
| 2025 | $1,935 | $19,486 | $3,090 | $16,396 |
| 2024 | $1,876 | $18,918 | $3,000 | $15,918 |
| 2023 | $1,876 | $18,368 | $3,000 | $15,368 |
| 2022 | $1,790 | $17,833 | $3,000 | $14,833 |
| 2021 | $1,606 | $15,864 | $3,000 | $12,864 |
| 2020 | $1,877 | $15,950 | $3,000 | $12,950 |
| 2019 | $1,576 | $15,795 | $2,791 | $13,004 |
| 2018 | $1,551 | $15,335 | $2,700 | $12,635 |
| 2017 | $1,561 | $15,335 | $2,700 | $12,635 |
| 2016 | $1,603 | $15,335 | $2,700 | $12,635 |
| 2015 | -- | $15,335 | $2,700 | $12,635 |
| 2014 | -- | $14,966 | $3,087 | $11,879 |
Source: Public Records
Map
Nearby Homes
- 37 E Fairlane Place
- 91 E Fairlane Ct
- 6 E Fairlane Dr
- 55 E Fairlane Ct Unit 3
- 14 E Portland Ave
- 2203 S Poplar St
- 2124 S Main St
- 226 W Orleans Ave
- 112 W Linda St
- 2600 S Hickory St
- 2806 S Hickory St
- 13623 S 97th Ave W
- 1965 S Scott St
- 71 W Mary Lynn Dr
- 119 E Ross Ave
- 1600 S Park St
- 1930 S Bixby St
- 28 W Goodykoontz Ave
- 1424 S Main St
- 215 W Burnham Ave
- 39 E Falcon Dr
- 47 E Falcon Dr
- 35 E Falcon Dr
- 42 E Fairlane Dr
- 46 E Fairlane Dr
- 38 E Fairlane Dr
- 34 E Fairlane Dr
- 31 E Falcon Dr
- 30 E Fairlane Dr
- 47 E Fairlane Dr
- 34 E Falcon Dr
- 26 E Fairlane Dr
- 27 E Falcon Dr
- 43 E Fairlane Dr
- 26 E Fairlane Dr
- 23 E Fairlane Dr
- 27 E Fairlane Dr
- 23 E Falcon Dr
- 19 E Fairlane Dr
- 39 E Fairlane Dr
Your Personal Tour Guide
Ask me questions while you tour the home.