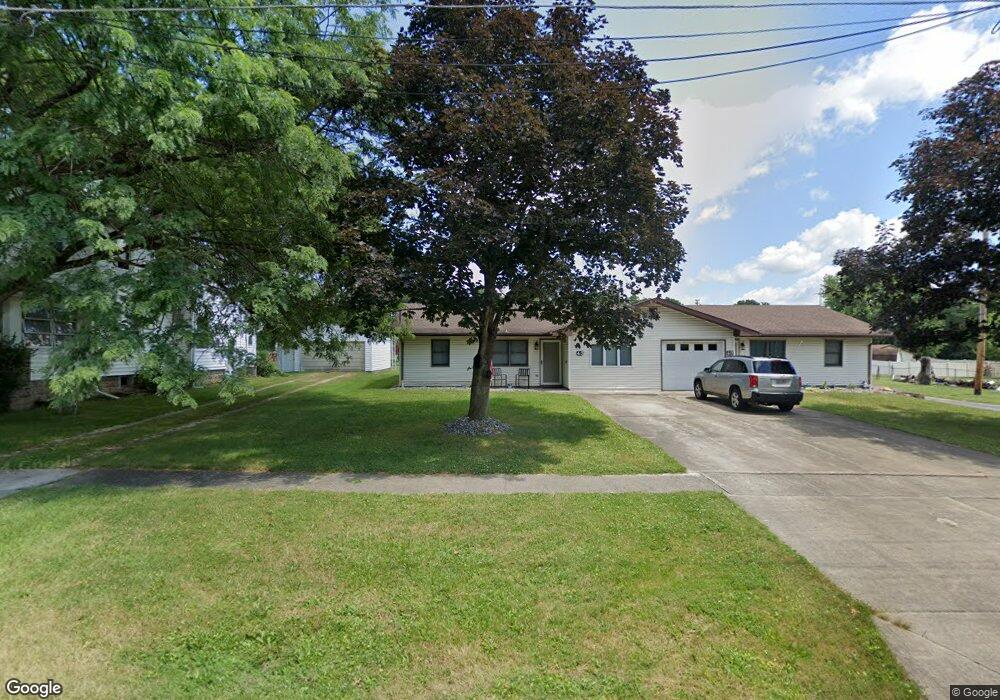
43 E Jay St Newton Falls, OH 44444
Estimated Value: $86,000 - $197,163
4
Beds
2
Baths
1,752
Sq Ft
$89/Sq Ft
Est. Value
About This Home
This home is located at 43 E Jay St, Newton Falls, OH 44444 and is currently estimated at $155,291, approximately $88 per square foot. 43 E Jay St is a home located in Trumbull County with nearby schools including Newton Falls Middle School, Newton Falls Junior High School, and Newton Falls High School.
Ownership History
Date
Name
Owned For
Owner Type
Purchase Details
Closed on
Dec 8, 2022
Sold by
Clonch Roy C
Bought by
Clonch Roy C and Clonch Jennifer
Current Estimated Value
Purchase Details
Closed on
Nov 22, 2017
Sold by
Clonch Roy C
Bought by
Clonch Roy C and Clonch Jennifer M
Home Financials for this Owner
Home Financials are based on the most recent Mortgage that was taken out on this home.
Original Mortgage
$136,000
Interest Rate
5%
Mortgage Type
Land Contract Argmt. Of Sale
Purchase Details
Closed on
May 26, 2016
Sold by
Roy Clonch J
Bought by
Aka Roy Clonch
Home Financials for this Owner
Home Financials are based on the most recent Mortgage that was taken out on this home.
Interest Rate
3.64%
Purchase Details
Closed on
Jan 1, 1990
Bought by
Roy Clonch
Create a Home Valuation Report for This Property
The Home Valuation Report is an in-depth analysis detailing your home's value as well as a comparison with similar homes in the area
Home Values in the Area
Average Home Value in this Area
Purchase History
| Date | Buyer | Sale Price | Title Company |
|---|---|---|---|
| Clonch Roy C | $100,000 | -- | |
| Clonch Roy C | $136,000 | None Available | |
| Aka Roy Clonch | -- | -- | |
| Roy Clonch | -- | -- |
Source: Public Records
Mortgage History
| Date | Status | Borrower | Loan Amount |
|---|---|---|---|
| Previous Owner | Clonch Roy C | $136,000 | |
| Previous Owner | Aka Roy Clonch | -- |
Source: Public Records
Tax History
| Year | Tax Paid | Tax Assessment Tax Assessment Total Assessment is a certain percentage of the fair market value that is determined by local assessors to be the total taxable value of land and additions on the property. | Land | Improvement |
|---|---|---|---|---|
| 2024 | $2,432 | $54,330 | $4,380 | $49,950 |
| 2023 | $2,416 | $54,330 | $4,380 | $49,950 |
| 2022 | $2,153 | $41,940 | $4,380 | $37,560 |
| 2021 | $2,285 | $41,940 | $4,380 | $37,560 |
| 2020 | $2,123 | $41,940 | $4,380 | $37,560 |
| 2019 | $2,141 | $39,800 | $4,380 | $35,420 |
| 2018 | $2,080 | $39,800 | $4,380 | $35,420 |
| 2017 | $2,075 | $39,800 | $4,380 | $35,420 |
| 2016 | $2,044 | $39,240 | $4,380 | $34,860 |
| 2015 | $2,036 | $39,240 | $4,380 | $34,860 |
| 2014 | $1,776 | $39,240 | $4,380 | $34,860 |
| 2013 | $1,795 | $42,670 | $4,380 | $38,290 |
Source: Public Records
Map
Nearby Homes
- 43 Bridge St
- 611 N Canal St
- 328 Oak Knoll Ave
- 344 Arlington Blvd
- 343 Morrison Ave
- 348 Arlington Blvd
- 123 W Church St
- 316 S Center St
- 726 Artesian Ave
- 2254 Milton Blvd
- 1835 Windham Rd
- 710 Russell St
- 2410 Railroad St
- 0 W Woodland Ave
- 321 Adams St
- 4409 Ophelia St
- 0 State Route 5 Unit 5085736
- 5580 Charleston Rd
- 2721 E River Rd
- 5044 Bright Baldwin Rd
Your Personal Tour Guide
Ask me questions while you tour the home.