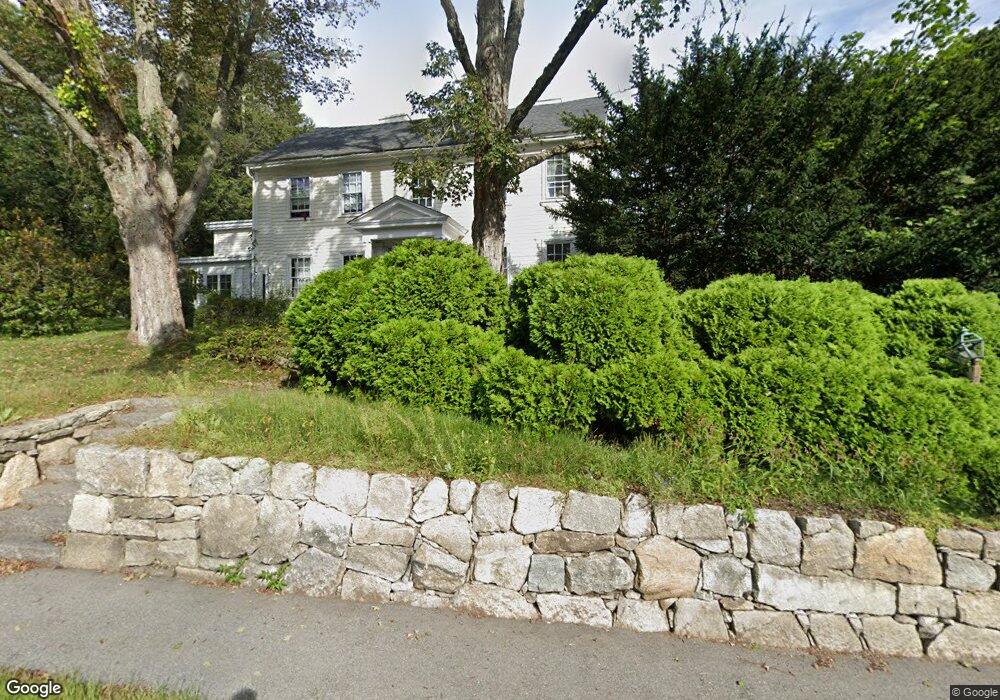
43 E Main St Hopkinton, MA 01748
Estimated Value: $805,000 - $1,078,000
4
Beds
3
Baths
2,814
Sq Ft
$356/Sq Ft
Est. Value
About This Home
This home is located at 43 E Main St, Hopkinton, MA 01748 and is currently estimated at $1,000,859, approximately $355 per square foot. 43 E Main St is a home located in Middlesex County with nearby schools including Elmwood Elementary School, Hopkins Elementary School, and Marathon Elementary School.
Ownership History
Date
Name
Owned For
Owner Type
Purchase Details
Closed on
May 3, 2024
Sold by
Dorcey Anna T and Roberts Henry
Bought by
Round 2 Enterprises Llc
Current Estimated Value
Purchase Details
Closed on
Oct 22, 2022
Sold by
East Main Nt and Taylor
Bought by
Graham-Taylor Christine E and Spengler David
Purchase Details
Closed on
Nov 30, 2010
Sold by
Dodson-Spengler Carol
Bought by
W Main Nt and Pantazelos
Create a Home Valuation Report for This Property
The Home Valuation Report is an in-depth analysis detailing your home's value as well as a comparison with similar homes in the area
Home Values in the Area
Average Home Value in this Area
Purchase History
| Date | Buyer | Sale Price | Title Company |
|---|---|---|---|
| Round 2 Enterprises Llc | -- | None Available | |
| Round 2 Enterprises Llc | -- | None Available | |
| Graham-Taylor Christine E | -- | None Available | |
| Graham-Taylor Christine E | -- | None Available | |
| W Main Nt | -- | -- | |
| W Main Nt | -- | -- |
Source: Public Records
Tax History
| Year | Tax Paid | Tax Assessment Tax Assessment Total Assessment is a certain percentage of the fair market value that is determined by local assessors to be the total taxable value of land and additions on the property. | Land | Improvement |
|---|---|---|---|---|
| 2025 | $12,148 | $856,700 | $399,600 | $457,100 |
| 2024 | $12,056 | $825,200 | $387,800 | $437,400 |
| 2023 | $9,840 | $622,400 | $308,300 | $314,100 |
| 2022 | $9,784 | $574,500 | $289,600 | $284,900 |
| 2021 | $9,351 | $547,500 | $283,900 | $263,600 |
| 2020 | $8,982 | $534,000 | $279,600 | $254,400 |
| 2019 | $8,515 | $495,900 | $262,900 | $233,000 |
| 2018 | $7,946 | $470,200 | $254,600 | $215,600 |
| 2017 | $7,681 | $457,200 | $251,600 | $205,600 |
| 2016 | $7,600 | $446,300 | $246,700 | $199,600 |
| 2015 | $7,644 | $425,600 | $242,400 | $183,200 |
Source: Public Records
Map
Nearby Homes
- 2 Grandview Dr
- 4 Grandview Dr
- 5 C St
- 49 Hayden Rowe St
- 13 Summer St
- 0 Stone Crossing Way
- 5 Heartwood Way Unit 123
- 30 Wayside Dr Unit 30
- 19 Crispwater Way Unit 178
- 8 Crispwater Way Unit 8
- 3 Fitch Ave Unit 14
- 5 W Main St
- 19 Wood St
- 6 Waterville Ln Unit 6
- 14 Waterville Ln Unit 14
- 40 Waterville Ln Unit 40
- 28 Waterville Ln Unit 28
- 38 Waterville Ln Unit 38
- 10 Fitch Ave Unit 9
- 36 Waterville Ln Unit 36
Your Personal Tour Guide
Ask me questions while you tour the home.