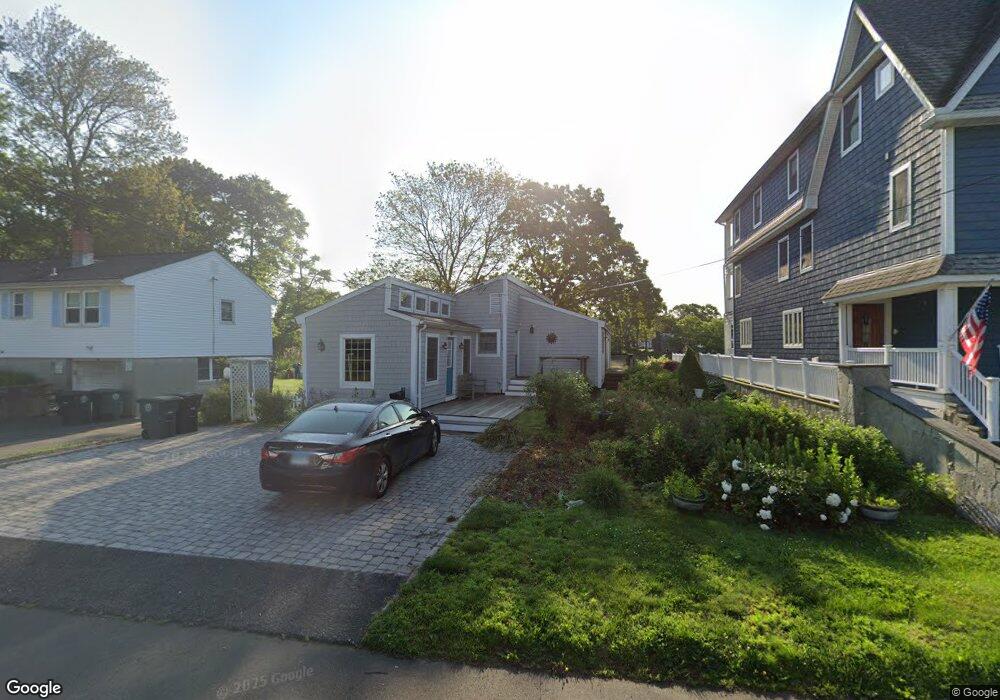
43 East Ave Milford, CT 06460
East Milford NeighborhoodEstimated Value: $445,325 - $553,000
2
Beds
2
Baths
1,080
Sq Ft
$464/Sq Ft
Est. Value
About This Home
This home is located at 43 East Ave, Milford, CT 06460 and is currently estimated at $501,081, approximately $463 per square foot. 43 East Ave is a home located in New Haven County with nearby schools including East Shore Middle School, Joseph A. Foran High School, and Milford Christian Academy.
Ownership History
Date
Name
Owned For
Owner Type
Purchase Details
Closed on
Nov 26, 2019
Sold by
Monaco Robert and Reverse Mortgage Solution
Bought by
Reverse Mortgage Solution
Current Estimated Value
Purchase Details
Closed on
Nov 26, 2018
Sold by
Monaco Robert and Reverse Mortgage Solution
Bought by
Reverse Mortgage Solution
Purchase Details
Closed on
Feb 14, 2014
Sold by
Rentz George D and Rentz Janet
Bought by
Osborn Timothy
Home Financials for this Owner
Home Financials are based on the most recent Mortgage that was taken out on this home.
Original Mortgage
$215,000
Interest Rate
3%
Mortgage Type
Adjustable Rate Mortgage/ARM
Purchase Details
Closed on
Feb 24, 2006
Sold by
Warjas Michael B
Bought by
Rentz George D and Rentz Janet A
Create a Home Valuation Report for This Property
The Home Valuation Report is an in-depth analysis detailing your home's value as well as a comparison with similar homes in the area
Home Values in the Area
Average Home Value in this Area
Purchase History
| Date | Buyer | Sale Price | Title Company |
|---|---|---|---|
| Reverse Mortgage Solution | -- | None Available | |
| Reverse Mortgage Solution | $153,000 | None Available | |
| Osborn Timothy | $215,000 | -- | |
| Rentz George D | $339,000 | -- | |
| Osborn Timothy | $215,000 | -- | |
| Rentz George D | $339,000 | -- |
Source: Public Records
Mortgage History
| Date | Status | Borrower | Loan Amount |
|---|---|---|---|
| Previous Owner | Osborn Timothy | $215,000 | |
| Previous Owner | Rentz George D | $439,612 | |
| Previous Owner | Rentz George D | $56,500 |
Source: Public Records
Tax History Compared to Growth
Tax History
| Year | Tax Paid | Tax Assessment Tax Assessment Total Assessment is a certain percentage of the fair market value that is determined by local assessors to be the total taxable value of land and additions on the property. | Land | Improvement |
|---|---|---|---|---|
| 2025 | $6,481 | $219,310 | $112,460 | $106,850 |
| 2024 | $6,391 | $219,310 | $112,460 | $106,850 |
| 2023 | $5,959 | $219,310 | $112,460 | $106,850 |
| 2022 | $5,845 | $219,310 | $112,460 | $106,850 |
| 2021 | $5,150 | $186,240 | $79,670 | $106,570 |
| 2020 | $5,155 | $186,240 | $79,670 | $106,570 |
| 2019 | $5,161 | $186,240 | $79,670 | $106,570 |
| 2018 | $5,166 | $186,240 | $79,670 | $106,570 |
| 2017 | $5,176 | $186,240 | $79,670 | $106,570 |
| 2016 | $5,187 | $186,330 | $75,880 | $110,450 |
| 2015 | $5,195 | $186,330 | $75,880 | $110,450 |
| 2014 | $5,072 | $186,330 | $75,880 | $110,450 |
Source: Public Records
Map
Nearby Homes
- 25 Summer Place
- 44 Chester St
- 7 Orland St
- 15 Melba St
- 44 Beachland Ave
- 5 Vine St
- 75 Long Island View Rd
- 180 Melba St Unit 205
- 105 Carriage Path S Unit 105 Carriage Path So
- 25 Carmen Rd
- 71 Platt St
- 18 Field Ct
- 470 Pond Point Ave
- 565 Pond Point Ave
- 571 Pond Point Ave
- 32 Morehouse Ave
- 10 Point Beach Dr
- 38 Elaine Rd
- 16 Point Beach Dr
- 13 Richard St