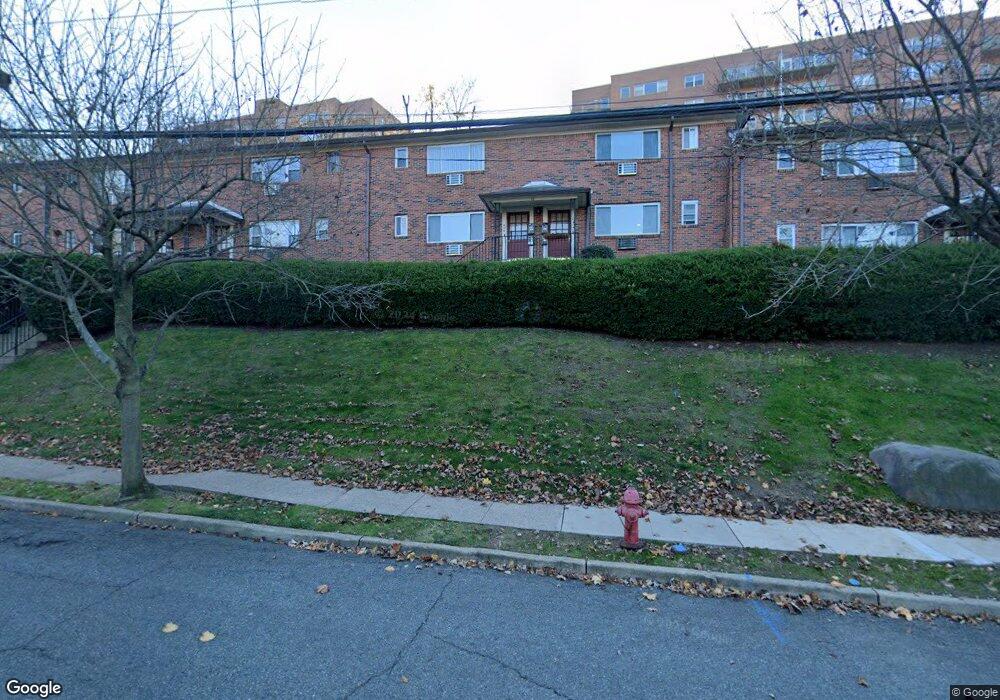
43 Espy Rd Unit C013A Caldwell, NJ 07006
Estimated Value: $300,626 - $326,000
--
Bed
--
Bath
787
Sq Ft
$399/Sq Ft
Est. Value
About This Home
This home is located at 43 Espy Rd Unit C013A, Caldwell, NJ 07006 and is currently estimated at $313,657, approximately $398 per square foot. 43 Espy Rd Unit C013A is a home located in Essex County with nearby schools including Washington Elementary School, James Caldwell High School, and Trinity Academy.
Ownership History
Date
Name
Owned For
Owner Type
Purchase Details
Closed on
Dec 31, 2021
Sold by
Chmielewski and Joseph
Bought by
Chmielewski Joseph and Chmielewski Rosann
Current Estimated Value
Home Financials for this Owner
Home Financials are based on the most recent Mortgage that was taken out on this home.
Original Mortgage
$155,500
Outstanding Balance
$143,200
Interest Rate
3.05%
Mortgage Type
New Conventional
Estimated Equity
$170,457
Purchase Details
Closed on
Dec 18, 2017
Sold by
Leddy Brian B and Leddy Lindita
Bought by
Chmielewski Peter and Chmielewski Joseph
Purchase Details
Closed on
Mar 27, 2014
Sold by
Lewis Kimberly R and Melchionne Kimberly R
Bought by
Manelli Lindita
Home Financials for this Owner
Home Financials are based on the most recent Mortgage that was taken out on this home.
Original Mortgage
$144,000
Interest Rate
4.37%
Mortgage Type
New Conventional
Create a Home Valuation Report for This Property
The Home Valuation Report is an in-depth analysis detailing your home's value as well as a comparison with similar homes in the area
Home Values in the Area
Average Home Value in this Area
Purchase History
| Date | Buyer | Sale Price | Title Company |
|---|---|---|---|
| Chmielewski Joseph | -- | Rosenberg Pllc | |
| Chmielewski Peter | $199,900 | -- | |
| Manelli Lindita | -- | None Available |
Source: Public Records
Mortgage History
| Date | Status | Borrower | Loan Amount |
|---|---|---|---|
| Open | Chmielewski Joseph | $155,500 | |
| Previous Owner | Manelli Lindita | $144,000 |
Source: Public Records
Tax History Compared to Growth
Tax History
| Year | Tax Paid | Tax Assessment Tax Assessment Total Assessment is a certain percentage of the fair market value that is determined by local assessors to be the total taxable value of land and additions on the property. | Land | Improvement |
|---|---|---|---|---|
| 2025 | $5,264 | $169,700 | $90,000 | $79,700 |
| 2024 | $5,264 | $169,700 | $90,000 | $79,700 |
| 2022 | $5,130 | $169,700 | $90,000 | $79,700 |
| 2021 | $4,884 | $169,700 | $90,000 | $79,700 |
| 2020 | $4,757 | $169,700 | $90,000 | $79,700 |
| 2019 | $4,735 | $169,700 | $90,000 | $79,700 |
| 2018 | $4,611 | $169,700 | $90,000 | $79,700 |
| 2017 | $4,517 | $169,700 | $90,000 | $79,700 |
| 2016 | $4,610 | $170,000 | $100,000 | $70,000 |
| 2015 | $4,398 | $170,000 | $100,000 | $70,000 |
| 2014 | $4,119 | $170,000 | $100,000 | $70,000 |
Source: Public Records
Map
Nearby Homes
- 5 Domessina Ln Unit E1
- 8 Domessina Ln Unit C1
- 1 Domessina Ln Unit F-6
- 1 Domessina Ln Unit F8
- 4 Domessina Ln
- 4 Domessina Ln Unit D1
- 26 Ravine Ave
- 27 Central Ave Unit F
- 11 Hillcrest Rd
- 4 Central Ave Unit E
- 30 Central Ave
- 122 Westover Ave
- 142 Central Ave
- 88 Park Ave
- 131 Westover Ave
- 27 Roseland Ave Unit 29
- 91 Roseland Ave Unit B4
- 53 Roseland Ave Unit 7
- 87 Roseland Ave Unit 97
- 53 Holiday Dr
- 43 Espy Rd Unit C013B
- 43 Espy Rd Unit C012B
- 43 Espy Rd Unit C012A
- 43 Espy Rd Unit 12A
- 43 Espy Rd Unit 13B
- 43 Espy Rd
- 43 Espy Rd Unit 13A
- 41 Espy Rd C011a Unit 11A
- 45 Espy Rd Unit C014B
- 45 Espy Rd Unit C015B
- 45 Espy Rd Unit C015A
- 45 Espy Rd Unit C014B
- 45 Espy Rd
- 45 Espy Rd Unit 14A
- 41 Espy Rd Unit C010B
- 41 Espy Rd Unit C011B
- 41 Espy Rd Unit C011A
- 41 Espy Rd Unit C010A
- 41 Espy Rd Unit 11B
- 41 Espy Rd