43 Evergreen Cir Manhasset, NY 11030
North Hills NeighborhoodEstimated Value: $3,015,648 - $4,166,000
4
Beds
5
Baths
4,066
Sq Ft
$883/Sq Ft
Est. Value
About This Home
This home is located at 43 Evergreen Cir, Manhasset, NY 11030 and is currently estimated at $3,590,824, approximately $883 per square foot. 43 Evergreen Cir is a home located in Nassau County with nearby schools including Manhasset Secondary School, Our Lady of Grace Montessori School, and Buckley Country Day School.
Ownership History
Date
Name
Owned For
Owner Type
Purchase Details
Closed on
Mar 8, 2016
Sold by
Luskin Sue K
Bought by
Wurtzel Alan and Wurtzel Susan
Current Estimated Value
Home Financials for this Owner
Home Financials are based on the most recent Mortgage that was taken out on this home.
Original Mortgage
$417,001
Outstanding Balance
$293,726
Interest Rate
3.1%
Mortgage Type
Adjustable Rate Mortgage/ARM
Estimated Equity
$3,297,098
Purchase Details
Closed on
Jun 22, 1999
Sold by
Bayswater Realty & Capital Corp
Bought by
Luskin Sue K
Home Financials for this Owner
Home Financials are based on the most recent Mortgage that was taken out on this home.
Original Mortgage
$225,000
Interest Rate
7.19%
Mortgage Type
Purchase Money Mortgage
Create a Home Valuation Report for This Property
The Home Valuation Report is an in-depth analysis detailing your home's value as well as a comparison with similar homes in the area
Home Values in the Area
Average Home Value in this Area
Purchase History
| Date | Buyer | Sale Price | Title Company |
|---|---|---|---|
| Wurtzel Alan | $2,570,000 | Blackstone Land Title Agency | |
| Wurtzel Alan | $2,570,000 | Blackstone Land Title Agency | |
| Wurtzel Alan | $2,570,000 | Blackstone Land Title Agency | |
| Luskin Sue K | $932,999 | -- | |
| Luskin Sue K | $932,999 | -- | |
| Luskin Sue K | $932,999 | -- | |
| Luskin Sue K | $932,999 | -- |
Source: Public Records
Mortgage History
| Date | Status | Borrower | Loan Amount |
|---|---|---|---|
| Open | Wurtzel Alan | $417,001 | |
| Closed | Wurtzel Alan | $417,001 | |
| Previous Owner | Luskin Sue K | $225,000 |
Source: Public Records
Tax History Compared to Growth
Tax History
| Year | Tax Paid | Tax Assessment Tax Assessment Total Assessment is a certain percentage of the fair market value that is determined by local assessors to be the total taxable value of land and additions on the property. | Land | Improvement |
|---|---|---|---|---|
| 2025 | $31,478 | $2,004 | $755 | $1,249 |
| 2024 | $10,047 | $2,169 | $817 | $1,352 |
| 2023 | $32,442 | $2,313 | $871 | $1,442 |
| 2022 | $32,442 | $2,612 | $984 | $1,628 |
| 2021 | $35,509 | $2,559 | $945 | $1,614 |
| 2020 | $34,811 | $3,640 | $2,236 | $1,404 |
| 2019 | $34,353 | $3,610 | $2,333 | $1,277 |
| 2018 | $32,034 | $3,610 | $0 | $0 |
| 2017 | $19,080 | $3,610 | $2,333 | $1,277 |
| 2016 | $28,790 | $3,610 | $1,973 | $1,637 |
| 2015 | $9,328 | $3,610 | $1,973 | $1,637 |
| 2014 | $9,328 | $3,610 | $1,973 | $1,637 |
| 2013 | $10,452 | $4,269 | $2,333 | $1,936 |
Source: Public Records
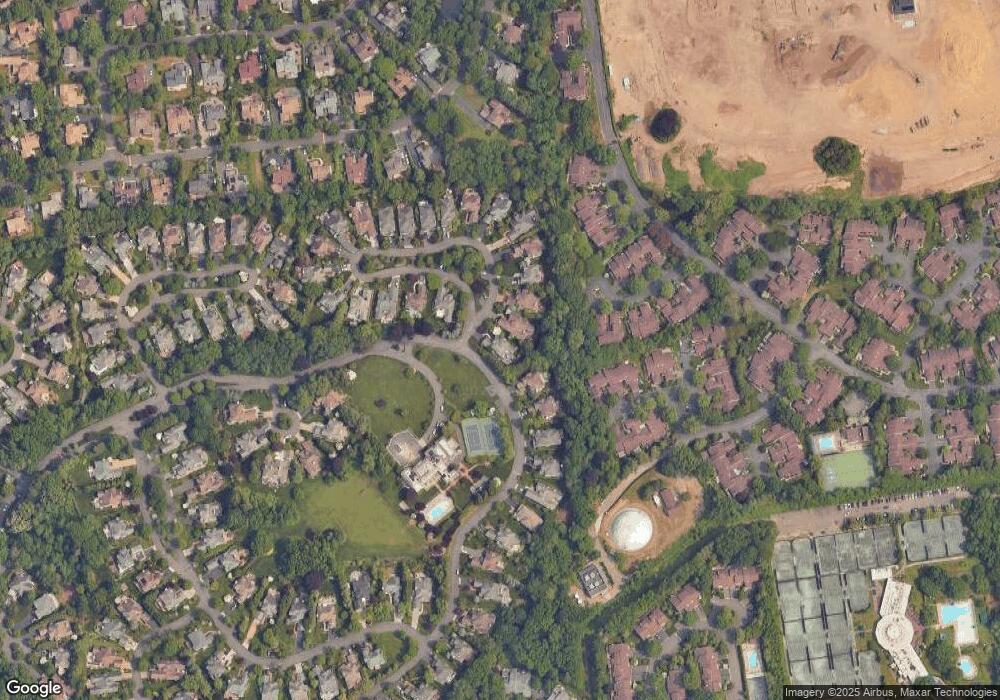
Map
Nearby Homes
- 17 Evergreen Cir
- 202 Hummingbird Rd
- 211 Hornbill Dr
- 291 Starling Ct
- 17 Sequoia Cir
- 18 Sequoia Cir
- 43 Bristol Dr
- 45 Bristol Dr
- 117 Eagles Crescent
- 21 Sequoia Cir
- 44 Sequoia Cir
- 22 Sequoia Cir
- 54 Harvard Rd
- 63 Sutton Place
- 35 Tiffany Cir
- 147 Darters Ln
- 23 Sequoia Cir
- 26 Sequoia Cir
- 12 Sequoia Cir
- 25 Sequoia Cir
- 41 Evergreen Cir
- 1 Gracewood Dr
- 39 Evergreen Cir
- 3 Gracewood Dr
- 1 Evergreen Cir
- 37 Evergreen Cir
- 5 Gracewood Dr
- 3 Evergreen Cir
- 194 Heron Ln
- 188 Gannet Ct
- 35 Evergreen Cir
- 193 Heron Ln
- 187 Gannet Ct
- 7 Gracewood Dr
- 0 Evergreen Cir Unit 2859115
- 0 Evergreen Cir Unit 2859041
- 192 Heron Ln
- 5 Evergreen Cir
- 33 Evergreen Cir
- 191 Heron Ln