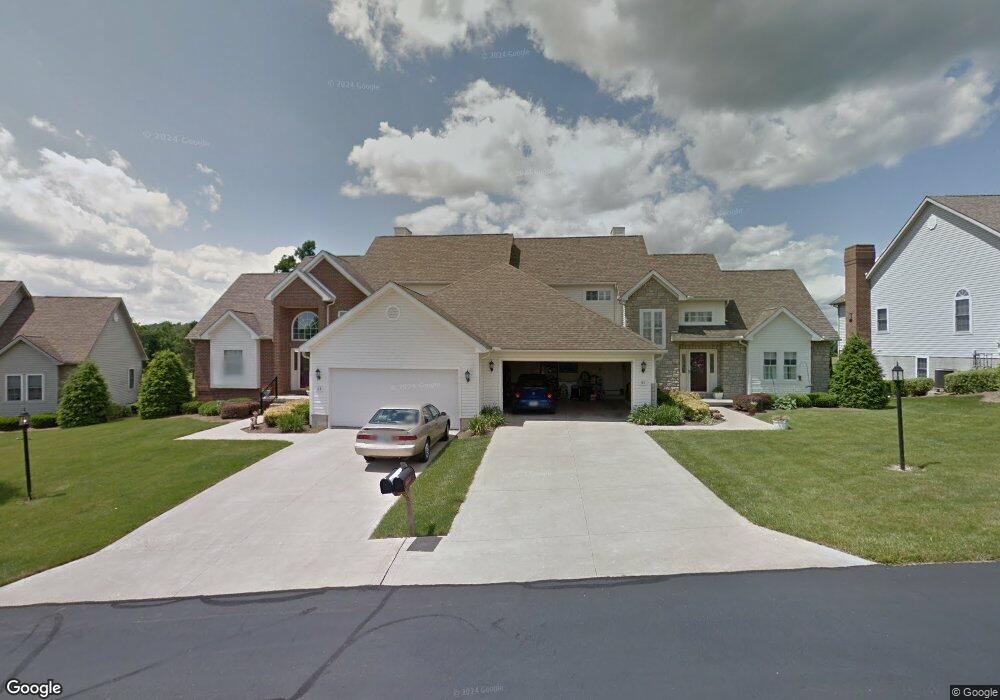
43 Fairway Dr Mount Vernon, OH 43050
Estimated Value: $296,000 - $330,000
3
Beds
3
Baths
1,770
Sq Ft
$175/Sq Ft
Est. Value
About This Home
This home is located at 43 Fairway Dr, Mount Vernon, OH 43050 and is currently estimated at $309,078, approximately $174 per square foot. 43 Fairway Dr is a home located in Knox County with nearby schools including Mount Vernon High School, St. Vincent de Paul School, and Christian Star Academy.
Ownership History
Date
Name
Owned For
Owner Type
Purchase Details
Closed on
Sep 18, 2009
Sold by
Ruiz Francisco J and Chesnut Judity W
Bought by
Chesnut Judith W and Chesnut Timothy G
Current Estimated Value
Purchase Details
Closed on
Aug 5, 2009
Sold by
Chesnut Judith W and Chesnut Melody L
Bought by
Chesnut Judith W and Chesnut Timothy G
Purchase Details
Closed on
Aug 23, 2002
Sold by
Young Scott A
Bought by
Chesnut Judith W and Chesnut Melody
Purchase Details
Closed on
Jan 12, 2000
Bought by
Young Scott A
Purchase Details
Closed on
Nov 22, 1999
Bought by
Fairways Of Mount Vernon
Create a Home Valuation Report for This Property
The Home Valuation Report is an in-depth analysis detailing your home's value as well as a comparison with similar homes in the area
Home Values in the Area
Average Home Value in this Area
Purchase History
| Date | Buyer | Sale Price | Title Company |
|---|---|---|---|
| Chesnut Judith W | -- | None Available | |
| Chesnut Judith W | -- | None Available | |
| Chesnut Judith W | $219,000 | -- | |
| Young Scott A | $197,900 | -- | |
| Fairways Of Mount Vernon | -- | -- |
Source: Public Records
Tax History Compared to Growth
Tax History
| Year | Tax Paid | Tax Assessment Tax Assessment Total Assessment is a certain percentage of the fair market value that is determined by local assessors to be the total taxable value of land and additions on the property. | Land | Improvement |
|---|---|---|---|---|
| 2024 | $3,421 | $98,520 | $8,720 | $89,800 |
| 2023 | $3,421 | $98,520 | $8,720 | $89,800 |
| 2022 | $2,765 | $72,440 | $6,410 | $66,030 |
| 2021 | $2,698 | $72,440 | $6,410 | $66,030 |
| 2020 | $2,628 | $72,440 | $6,410 | $66,030 |
| 2019 | $2,407 | $63,130 | $3,590 | $59,540 |
| 2018 | $2,407 | $63,130 | $3,590 | $59,540 |
| 2017 | $2,364 | $63,130 | $3,590 | $59,540 |
| 2016 | $2,165 | $58,450 | $3,320 | $55,130 |
| 2015 | $2,174 | $58,450 | $3,320 | $55,130 |
| 2014 | $2,185 | $58,450 | $3,320 | $55,130 |
| 2013 | $2,398 | $60,730 | $3,560 | $57,170 |
Source: Public Records
Map
Nearby Homes