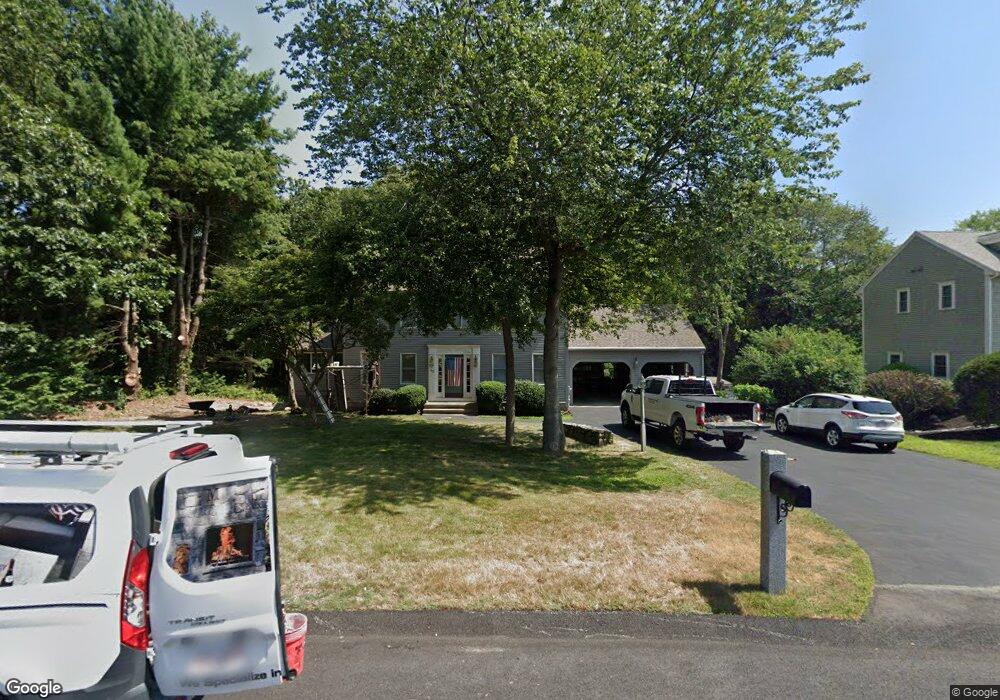
43 Fieldstone Ln East Weymouth, MA 02189
East Weymouth NeighborhoodEstimated Value: $671,000 - $801,227
3
Beds
3
Baths
1,768
Sq Ft
$411/Sq Ft
Est. Value
About This Home
This home is located at 43 Fieldstone Ln, East Weymouth, MA 02189 and is currently estimated at $726,557, approximately $410 per square foot. 43 Fieldstone Ln is a home located in Norfolk County with nearby schools including Abigail Adams Middle School, William Seach Elementary School, and Weymouth Middle School Chapman.
Ownership History
Date
Name
Owned For
Owner Type
Purchase Details
Closed on
Oct 6, 1988
Sold by
Fieldstone Hll Dev
Bought by
Ritchie Thomas A
Current Estimated Value
Home Financials for this Owner
Home Financials are based on the most recent Mortgage that was taken out on this home.
Original Mortgage
$202,300
Interest Rate
10.64%
Mortgage Type
Purchase Money Mortgage
Create a Home Valuation Report for This Property
The Home Valuation Report is an in-depth analysis detailing your home's value as well as a comparison with similar homes in the area
Home Values in the Area
Average Home Value in this Area
Purchase History
| Date | Buyer | Sale Price | Title Company |
|---|---|---|---|
| Ritchie Thomas A | $252,922 | -- |
Source: Public Records
Mortgage History
| Date | Status | Borrower | Loan Amount |
|---|---|---|---|
| Open | Ritchie Thomas A | $155,000 | |
| Closed | Ritchie Thomas A | $202,300 |
Source: Public Records
Tax History Compared to Growth
Tax History
| Year | Tax Paid | Tax Assessment Tax Assessment Total Assessment is a certain percentage of the fair market value that is determined by local assessors to be the total taxable value of land and additions on the property. | Land | Improvement |
|---|---|---|---|---|
| 2025 | $7,966 | $788,700 | $251,800 | $536,900 |
| 2024 | $7,788 | $758,300 | $239,800 | $518,500 |
| 2023 | $7,131 | $682,400 | $222,100 | $460,300 |
| 2022 | $6,912 | $603,100 | $205,600 | $397,500 |
| 2021 | $6,621 | $564,000 | $205,600 | $358,400 |
| 2020 | $6,417 | $538,300 | $205,600 | $332,700 |
| 2019 | $6,258 | $516,300 | $197,700 | $318,600 |
| 2018 | $6,309 | $504,700 | $205,400 | $299,300 |
| 2017 | $6,003 | $468,600 | $195,600 | $273,000 |
| 2016 | $5,915 | $462,100 | $188,100 | $274,000 |
| 2015 | $5,691 | $441,200 | $188,100 | $253,100 |
| 2014 | $5,456 | $410,200 | $175,100 | $235,100 |
Source: Public Records
Map
Nearby Homes
- 303 Middle St
- 42 Sundin Rd
- 449 Middle St
- 209 Lake St Unit 69
- 286 Essex St
- 575 Broad St Unit 305
- 575 Broad St Unit 215
- 12 Klasson Ln
- 286 Broad St
- 367 Essex St
- 211 Lake Shore Dr
- 145 Jaffrey St
- 56 Putnam St
- 215 Winter St Unit 1P
- 19 Vine St Unit 3
- 19 Vine St Unit 1
- 33 Congress St
- 16 Oak Cliff Rd
- 966 Washington St Unit 2
- 747 Middle St
- 35 Fieldstone Ln
- 52 Fieldstone Ln
- 17 Fieldstone Ln
- 32 Fieldstone Ln
- 49 Fieldstone Ln
- 55 Fieldstone Ln
- 70 Fieldstone Ln
- 98 Fieldstone Ln
- 121 Fieldstone Ln
- 65 Fieldstone Ln
- 349 Middle St
- 329 Middle St
- 109 Fieldstone Ln
- 307 Middle St
- 73 Fieldstone Ln
- 323 Middle St
- 355 Middle St
- 103 Fieldstone Ln
- 95 Fieldstone Ln
- 81 Fieldstone Ln