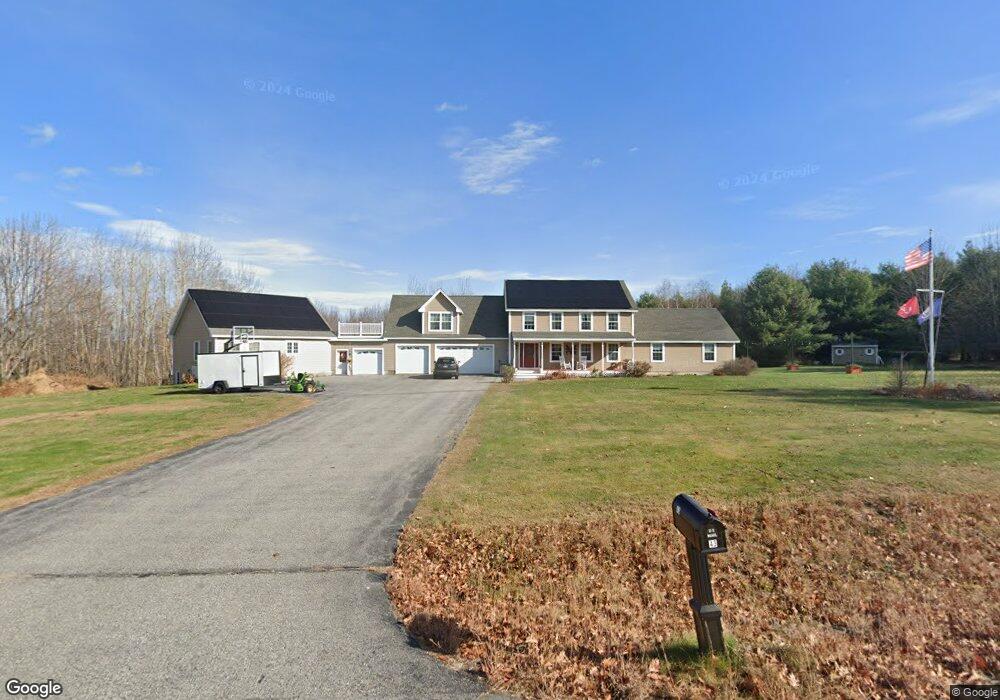
43 Fieldstone Ridge Dr Cornish, ME 04020
Estimated Value: $477,000 - $718,482
6
Beds
5
Baths
4,332
Sq Ft
$135/Sq Ft
Est. Value
About This Home
This home is located at 43 Fieldstone Ridge Dr, Cornish, ME 04020 and is currently estimated at $585,827, approximately $135 per square foot. 43 Fieldstone Ridge Dr is a home located in York County.
Ownership History
Date
Name
Owned For
Owner Type
Purchase Details
Closed on
May 22, 2018
Sold by
Stanton Richard M and Miller Samuel H
Bought by
Miller Samuel H and Miller Sara B
Current Estimated Value
Home Financials for this Owner
Home Financials are based on the most recent Mortgage that was taken out on this home.
Original Mortgage
$350,000
Interest Rate
4.4%
Mortgage Type
New Conventional
Create a Home Valuation Report for This Property
The Home Valuation Report is an in-depth analysis detailing your home's value as well as a comparison with similar homes in the area
Home Values in the Area
Average Home Value in this Area
Purchase History
| Date | Buyer | Sale Price | Title Company |
|---|---|---|---|
| Miller Samuel H | -- | -- | |
| Miller Samuel H | -- | -- | |
| Miller Samuel H | -- | -- | |
| Miller Samuel H | -- | -- |
Source: Public Records
Mortgage History
| Date | Status | Borrower | Loan Amount |
|---|---|---|---|
| Closed | Miller Samuel H | $350,000 | |
| Closed | Miller Samuel H | $50,000 |
Source: Public Records
Tax History Compared to Growth
Tax History
| Year | Tax Paid | Tax Assessment Tax Assessment Total Assessment is a certain percentage of the fair market value that is determined by local assessors to be the total taxable value of land and additions on the property. | Land | Improvement |
|---|---|---|---|---|
| 2025 | $5,963 | $631,000 | $92,500 | $538,500 |
| 2024 | $5,871 | $638,200 | $107,400 | $530,800 |
| 2023 | $5,967 | $417,300 | $53,900 | $363,400 |
| 2022 | $5,759 | $417,300 | $53,900 | $363,400 |
| 2021 | $5,634 | $417,300 | $53,900 | $363,400 |
| 2020 | $5,592 | $417,300 | $53,900 | $363,400 |
| 2019 | $5,592 | $417,300 | $53,900 | $363,400 |
| 2018 | $5,634 | $417,300 | $53,900 | $363,400 |
| 2016 | $4,432 | $343,800 | $53,900 | $289,900 |
| 2015 | $4,435 | $343,800 | $53,900 | $289,900 |
| 2014 | $4,435 | $343,800 | $53,900 | $289,900 |
Source: Public Records
Map
Nearby Homes
- Lot #3 Jordan Heights Rd
- Lot #2 Jordan Heights Rd
- Lot #8 Jordan Heights Rd
- Lot #4 Jordan Heights Rd
- Lot #11 Jordan Heights Rd
- 22 High Rd
- 20 Main St
- 96 Maple St
- 4 Bridge St
- 696 S Hiram Rd
- 6-13 Main St
- 30 Waterfront Dr
- Lot #5 Jordan Heights Rd
- 266 S Hiram Rd
- 992 Pequawket Trail
- 20 Hollyhock Farm Ln
- 11 Marston Rd
- 1323 Cape Rd
- 174 Marston Rd
- 35 Pine St
- 88 Fieldstone Ridge Dr
- 53 Fieldstone Ridge Dr
- 60 Fieldstone Ridge Dr
- 38 Fieldstone Ridge Dr
- 37 Broken Hill Dr
- 66 Fieldstone Ridge Dr
- Lot 3 Fieldstone Ridge Dr
- 93 Fieldstone Ridge Dr
- Lot 6 Fieldstone Ridge Dr
- 89 Old High Rd
- 5 Fieldstone Ridge
- Lot 5 Fieldstone Ridge
- 69 Old High Rd
- 3 Fieldstone Ridge
- 68 Raven Rd
- 72 Old High Rd
- 51 Old High Rd
- 107 Old High Rd
- 40 Raven Rd
- 61 Raven Rd