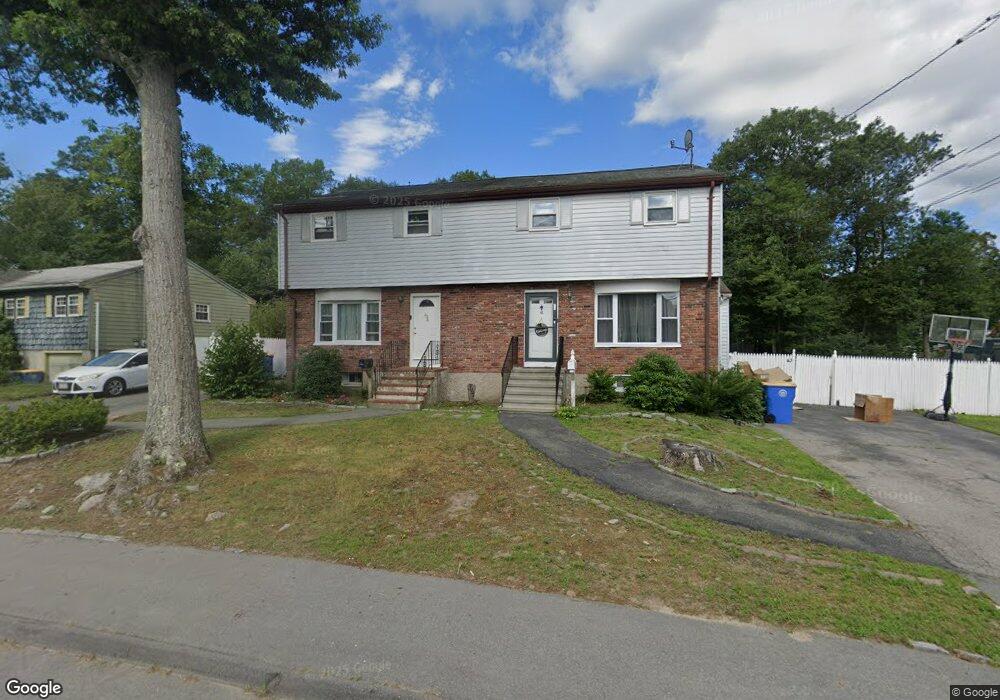
43 Fitch Terrace Unit A Randolph, MA 02368
Downtown Randolph NeighborhoodEstimated Value: $435,050 - $486,000
3
Beds
2
Baths
1,236
Sq Ft
$372/Sq Ft
Est. Value
About This Home
This home is located at 43 Fitch Terrace Unit A, Randolph, MA 02368 and is currently estimated at $459,513, approximately $371 per square foot. 43 Fitch Terrace Unit A is a home located in Norfolk County with nearby schools including Randolph High School and Lighthouse Baptist Christian Academy.
Ownership History
Date
Name
Owned For
Owner Type
Purchase Details
Closed on
Oct 20, 2017
Sold by
Summers Robert and Summers Dawn M
Bought by
Vassell Marcia E
Current Estimated Value
Home Financials for this Owner
Home Financials are based on the most recent Mortgage that was taken out on this home.
Original Mortgage
$229,500
Outstanding Balance
$191,491
Interest Rate
3.78%
Mortgage Type
New Conventional
Estimated Equity
$268,022
Purchase Details
Closed on
May 1, 2009
Sold by
Ubs Re Securities Inc
Bought by
Wachira Lawrence
Purchase Details
Closed on
Feb 22, 2002
Sold by
Louis Emilia A
Bought by
Summers Robert
Home Financials for this Owner
Home Financials are based on the most recent Mortgage that was taken out on this home.
Original Mortgage
$174,400
Interest Rate
7.08%
Mortgage Type
Purchase Money Mortgage
Purchase Details
Closed on
Jan 10, 1997
Sold by
Murray Richard M and Murray Joan
Bought by
Murray Timothy F and Murray Mary
Home Financials for this Owner
Home Financials are based on the most recent Mortgage that was taken out on this home.
Original Mortgage
$136,000
Interest Rate
7.46%
Mortgage Type
Purchase Money Mortgage
Create a Home Valuation Report for This Property
The Home Valuation Report is an in-depth analysis detailing your home's value as well as a comparison with similar homes in the area
Home Values in the Area
Average Home Value in this Area
Purchase History
| Date | Buyer | Sale Price | Title Company |
|---|---|---|---|
| Vassell Marcia E | $270,000 | -- | |
| Wachira Lawrence | $131,250 | -- | |
| Summers Robert | $218,000 | -- | |
| Murray Timothy F | $170,000 | -- |
Source: Public Records
Mortgage History
| Date | Status | Borrower | Loan Amount |
|---|---|---|---|
| Open | Vassell Marcia E | $229,500 | |
| Previous Owner | Summers Robert | $174,400 | |
| Previous Owner | Murray Timothy F | $136,000 |
Source: Public Records
Tax History Compared to Growth
Tax History
| Year | Tax Paid | Tax Assessment Tax Assessment Total Assessment is a certain percentage of the fair market value that is determined by local assessors to be the total taxable value of land and additions on the property. | Land | Improvement |
|---|---|---|---|---|
| 2025 | $4,224 | $363,800 | $0 | $363,800 |
| 2024 | $4,258 | $371,900 | $0 | $371,900 |
| 2023 | $3,895 | $322,400 | $0 | $322,400 |
| 2022 | $3,774 | $277,500 | $0 | $277,500 |
| 2021 | $3,572 | $241,700 | $0 | $241,700 |
| 2020 | $3,665 | $245,800 | $0 | $245,800 |
| 2019 | $3,573 | $238,500 | $0 | $238,500 |
| 2018 | $2,738 | $172,400 | $0 | $172,400 |
| 2017 | $2,662 | $164,500 | $0 | $164,500 |
| 2016 | $2,588 | $148,800 | $0 | $148,800 |
| 2015 | $2,532 | $139,900 | $0 | $139,900 |
Source: Public Records
Map
Nearby Homes
- 24 Cole Terrace
- 7 Brookside Terrace
- 20 Selwyn Rd
- 40 Linden Park Dr
- 65 Lheureux Cir
- 30 Hemlock Terrace
- 59 Highland Glen Dr Unit 328
- 4 Lori Ln
- 159 Bittersweet Ln Unit 107
- 631 Page St
- 15 Barbara Rd
- 503 Page St
- 46 Union Square Unit 46
- 17 Mazzeo Dr
- 9 Madison Ave
- 28 Silver St
- 7 Oakwood Ave
- 545 Page St Unit 208
- 5 Patterson Ave E
- 43 Toscano Way Unit 43
- 43 Fitch Terrace Unit A1
- 43 Fitch Terrace Unit B
- 43 Fitch Terrace
- 43 Fitch Terrace
- 43 Fitch Terrace Unit 43A
- 41 Fitch Terrace
- 45 Fitch Terrace
- 42 Fitch Terrace
- 39 Fitch Terrace
- 40 Fitch Terrace
- 12 Bayberry Ln
- 14 Bayberry Ln
- 10 Bayberry Ln
- 37 Fitch Terrace
- 16 Bayberry Ln
- 8 Bayberry Ln
- 2 Crickett Ln
- 47 Fitch Terrace Unit B
- 47 Fitch Terrace Unit A
- 47 Fitch Terrace Unit B (Right)