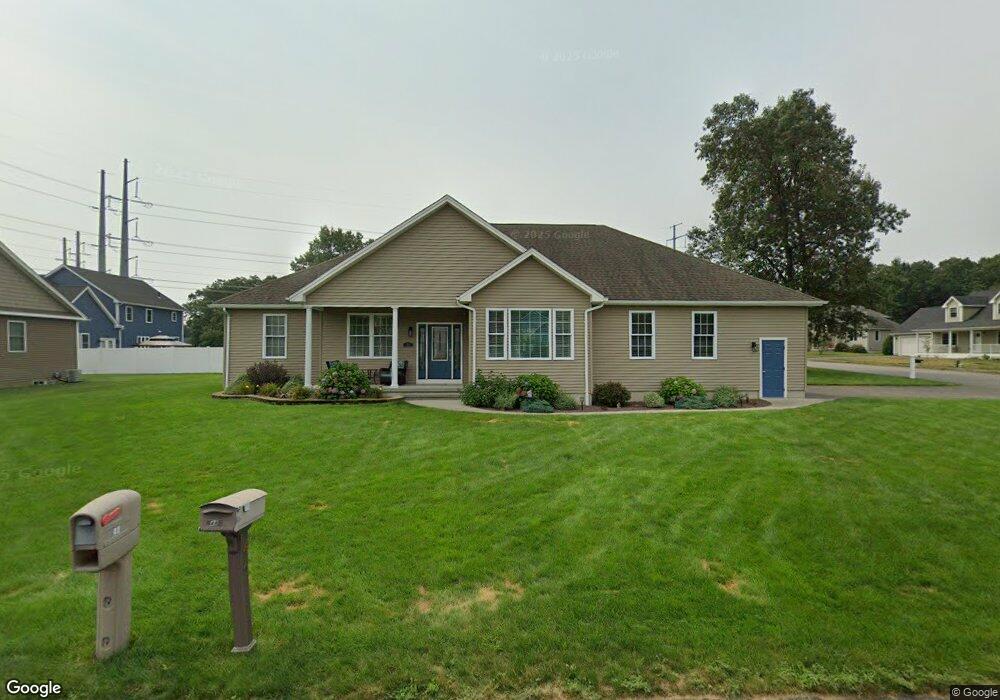
43 Focosi Ln Ludlow, MA 01056
Estimated Value: $461,172 - $541,000
3
Beds
2
Baths
2,126
Sq Ft
$241/Sq Ft
Est. Value
About This Home
This home is located at 43 Focosi Ln, Ludlow, MA 01056 and is currently estimated at $513,043, approximately $241 per square foot. 43 Focosi Ln is a home with nearby schools including East Street Elementary School, Chapin Street Elementary School, and Paul R. Baird Middle School.
Ownership History
Date
Name
Owned For
Owner Type
Purchase Details
Closed on
May 14, 2014
Sold by
Pires Arthur and Pires Maria H
Bought by
Simard Robert J and Simard Jeanne T
Current Estimated Value
Home Financials for this Owner
Home Financials are based on the most recent Mortgage that was taken out on this home.
Original Mortgage
$250,000
Outstanding Balance
$190,065
Interest Rate
4.42%
Mortgage Type
New Conventional
Estimated Equity
$322,978
Purchase Details
Closed on
Mar 23, 2010
Sold by
Misha Dev Llc and Freitas
Bought by
Pires Arthur and Pires Maria H
Create a Home Valuation Report for This Property
The Home Valuation Report is an in-depth analysis detailing your home's value as well as a comparison with similar homes in the area
Home Values in the Area
Average Home Value in this Area
Purchase History
| Date | Buyer | Sale Price | Title Company |
|---|---|---|---|
| Simard Robert J | $323,500 | -- | |
| Simard Robert J | $323,500 | -- | |
| Pires Arthur | $90,000 | -- | |
| Pires Arthur | $90,000 | -- | |
| Pires Arthur | $90,000 | -- |
Source: Public Records
Mortgage History
| Date | Status | Borrower | Loan Amount |
|---|---|---|---|
| Open | Simard Robert J | $250,000 | |
| Closed | Pires Arthur | $250,000 |
Source: Public Records
Tax History Compared to Growth
Tax History
| Year | Tax Paid | Tax Assessment Tax Assessment Total Assessment is a certain percentage of the fair market value that is determined by local assessors to be the total taxable value of land and additions on the property. | Land | Improvement |
|---|---|---|---|---|
| 2025 | $7,424 | $427,900 | $85,400 | $342,500 |
| 2024 | $7,627 | $421,600 | $85,200 | $336,400 |
| 2023 | $7,453 | $382,000 | $74,800 | $307,200 |
| 2022 | $7,072 | $353,800 | $74,800 | $279,000 |
| 2021 | $7,087 | $336,200 | $74,800 | $261,400 |
| 2020 | $6,840 | $331,700 | $73,600 | $258,100 |
| 2019 | $6,487 | $327,300 | $72,900 | $254,400 |
| 2018 | $6,053 | $318,400 | $72,900 | $245,500 |
| 2017 | $5,939 | $320,500 | $71,500 | $249,000 |
| 2016 | $5,185 | $286,000 | $70,100 | $215,900 |
| 2015 | $5,443 | $314,800 | $69,300 | $245,500 |
Source: Public Records
Map
Nearby Homes