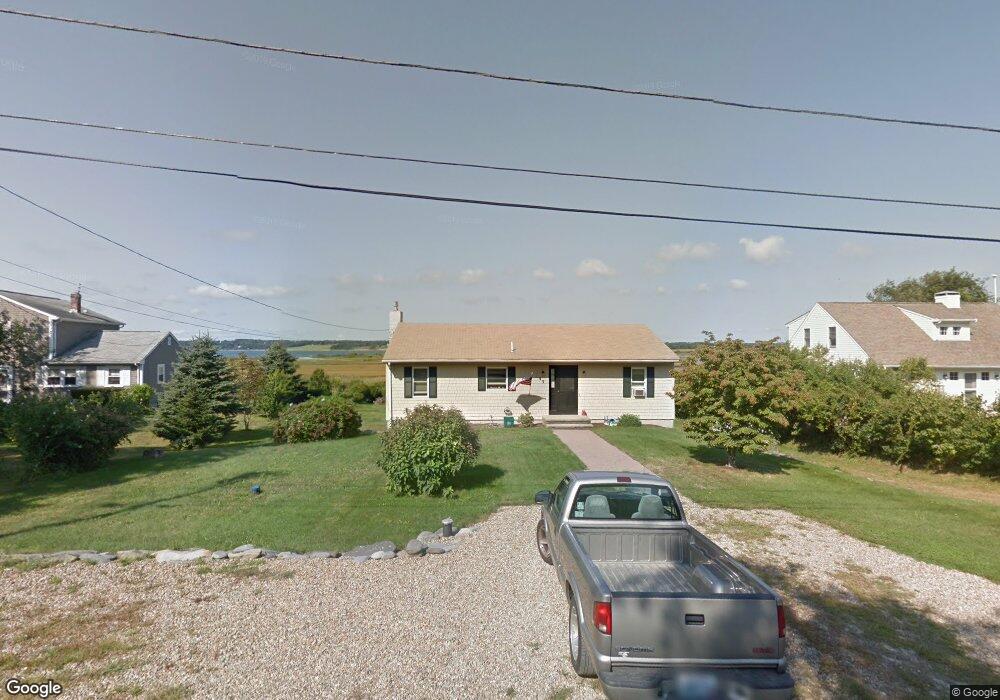
43 Francis Ln Little Compton, RI 02837
Estimated Value: $831,636 - $1,024,000
3
Beds
3
Baths
1,848
Sq Ft
$509/Sq Ft
Est. Value
About This Home
This home is located at 43 Francis Ln, Little Compton, RI 02837 and is currently estimated at $940,909, approximately $509 per square foot. 43 Francis Ln is a home located in Newport County with nearby schools including Wilbur & McMahon School.
Ownership History
Date
Name
Owned For
Owner Type
Purchase Details
Closed on
Jul 30, 2019
Sold by
Mcandrew William T and Mcandrew Jane M
Bought by
Keeney Katherine M and Keeney Stephen Ellen
Current Estimated Value
Purchase Details
Closed on
Sep 28, 1999
Sold by
Renquin Joseph L
Bought by
Mcandrew William T and Mcandrew Janet M
Home Financials for this Owner
Home Financials are based on the most recent Mortgage that was taken out on this home.
Original Mortgage
$194,000
Interest Rate
8.1%
Mortgage Type
Purchase Money Mortgage
Create a Home Valuation Report for This Property
The Home Valuation Report is an in-depth analysis detailing your home's value as well as a comparison with similar homes in the area
Home Values in the Area
Average Home Value in this Area
Purchase History
| Date | Buyer | Sale Price | Title Company |
|---|---|---|---|
| Keeney Katherine M | -- | -- | |
| Keeney Katherine M | -- | -- | |
| Mcandrew William T | $242,500 | -- | |
| Mcandrew William T | $242,500 | -- |
Source: Public Records
Mortgage History
| Date | Status | Borrower | Loan Amount |
|---|---|---|---|
| Previous Owner | Mcandrew William T | $170,000 | |
| Previous Owner | Mcandrew William T | $185,000 | |
| Previous Owner | Mcandrew William T | $194,000 |
Source: Public Records
Tax History
| Year | Tax Paid | Tax Assessment Tax Assessment Total Assessment is a certain percentage of the fair market value that is determined by local assessors to be the total taxable value of land and additions on the property. | Land | Improvement |
|---|---|---|---|---|
| 2025 | $3,467 | $723,700 | $475,200 | $248,500 |
| 2024 | $3,284 | $646,500 | $378,700 | $267,800 |
| 2023 | $3,207 | $646,500 | $378,700 | $267,800 |
| 2022 | $3,050 | $622,500 | $378,700 | $243,800 |
| 2021 | $3,106 | $514,300 | $329,300 | $185,000 |
| 2020 | $3,081 | $514,300 | $329,300 | $185,000 |
| 2019 | $3,050 | $514,300 | $329,300 | $185,000 |
| 2018 | $3,328 | $558,400 | $344,300 | $214,100 |
| 2016 | $3,166 | $558,400 | $344,300 | $214,100 |
| 2015 | $2,934 | $510,300 | $340,300 | $170,000 |
| 2014 | $2,837 | $503,100 | $340,300 | $162,800 |
Source: Public Records
Map
Nearby Homes
- 155 W Main Rd
- 17 Ferolbink Way
- 180 W Main Rd
- 24 Peaceful Way
- 141 Peckham Rd
- 0 Indian Ave
- 180 Cottontail Dr
- 0 Willow Ave
- 12 Taylor Rd
- 125 Heidi Dr
- 415 Wapping Rd
- 140I Long Hwy
- 140 Long Hwy
- 225 Old Mill Ln
- 90 Two Rod Rd
- 3622 Main Rd
- 362 Bramans Ln
- 505 Long Hwy
- 0 S Lake Rd Unit 73361665
- 0 S Lake Rd Unit 1382842
Your Personal Tour Guide
Ask me questions while you tour the home.