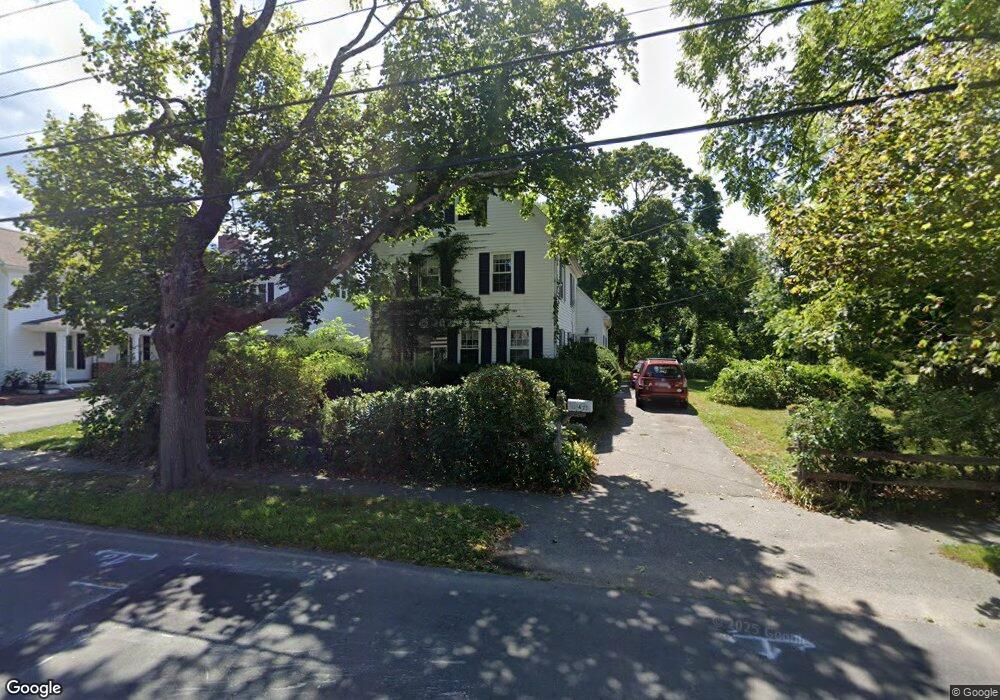
43 Free St Hingham, MA 02043
Estimated Value: $837,936 - $1,314,000
3
Beds
2
Baths
1,205
Sq Ft
$913/Sq Ft
Est. Value
About This Home
This home is located at 43 Free St, Hingham, MA 02043 and is currently estimated at $1,100,484, approximately $913 per square foot. 43 Free St is a home located in Plymouth County with nearby schools including East Elementary School, Hingham Middle School, and Hingham High School.
Ownership History
Date
Name
Owned For
Owner Type
Purchase Details
Closed on
Jul 28, 1992
Sold by
Giovanniello Thomas and Giovanniello Giovannielloe C
Bought by
Darrell Henry J and Darrell Susan S
Current Estimated Value
Purchase Details
Closed on
Aug 22, 1991
Sold by
Kaplan Lawrence C and Kaplan Nora
Bought by
Giovanniello Thos J and Giovanniello Chris
Create a Home Valuation Report for This Property
The Home Valuation Report is an in-depth analysis detailing your home's value as well as a comparison with similar homes in the area
Purchase History
| Date | Buyer | Sale Price | Title Company |
|---|---|---|---|
| Darrell Henry J | $177,000 | -- | |
| Giovanniello Thos J | $172,000 | -- |
Source: Public Records
Mortgage History
| Date | Status | Borrower | Loan Amount |
|---|---|---|---|
| Open | Giovanniello Thos J | $238,500 | |
| Closed | Giovanniello Thos J | $238,500 | |
| Closed | Giovanniello Thos J | $178,000 |
Source: Public Records
Tax History Compared to Growth
Tax History
| Year | Tax Paid | Tax Assessment Tax Assessment Total Assessment is a certain percentage of the fair market value that is determined by local assessors to be the total taxable value of land and additions on the property. | Land | Improvement |
|---|---|---|---|---|
| 2025 | $8,277 | $774,300 | $539,800 | $234,500 |
| 2024 | $8,177 | $753,600 | $539,800 | $213,800 |
| 2023 | $7,340 | $734,000 | $539,800 | $194,200 |
| 2022 | $6,973 | $603,200 | $447,300 | $155,900 |
| 2021 | $6,955 | $589,400 | $447,300 | $142,100 |
| 2020 | $6,796 | $589,400 | $447,300 | $142,100 |
| 2019 | $4,507 | $580,100 | $447,300 | $132,800 |
| 2018 | $6,828 | $580,100 | $447,300 | $132,800 |
| 2017 | $6,864 | $560,300 | $445,900 | $114,400 |
| 2016 | $6,733 | $539,100 | $424,700 | $114,400 |
| 2015 | $6,499 | $518,700 | $404,300 | $114,400 |
Source: Public Records
Map
Nearby Homes