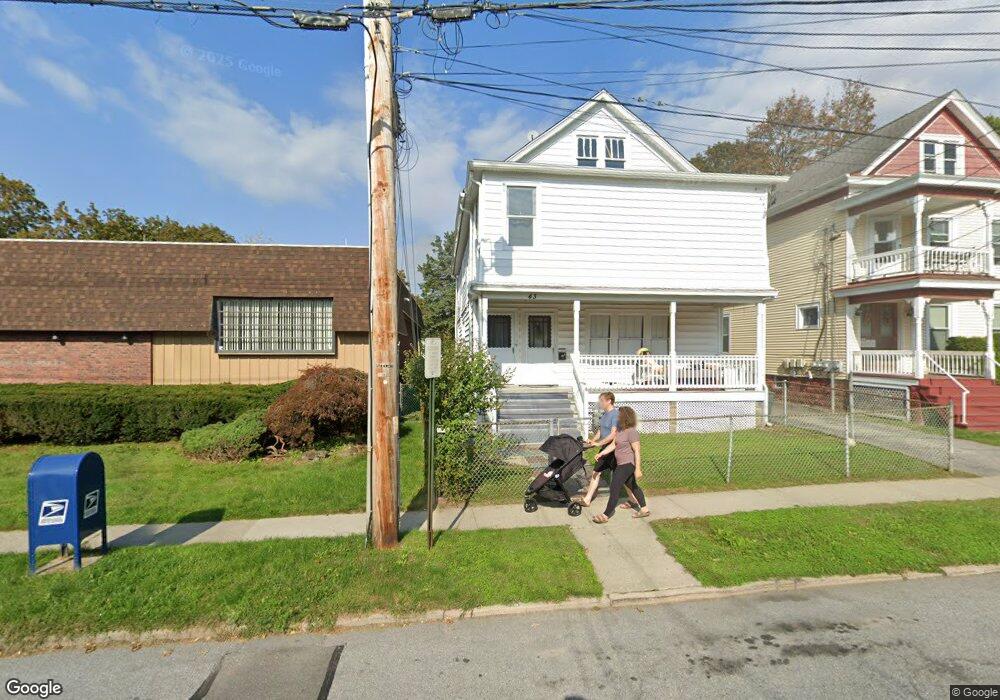
43 Fulton Ave Poughkeepsie, NY 12603
Estimated Value: $367,000 - $448,071
4
Beds
2
Baths
2,436
Sq Ft
$166/Sq Ft
Est. Value
About This Home
This home is located at 43 Fulton Ave, Poughkeepsie, NY 12603 and is currently estimated at $404,268, approximately $165 per square foot. 43 Fulton Ave is a home located in Dutchess County with nearby schools including Poughkeepsie High School, Holy Trinity School, and Poughkeepsie Community Seventh-Day Adventist School.
Ownership History
Date
Name
Owned For
Owner Type
Purchase Details
Closed on
Sep 20, 2022
Sold by
Cerqueira Joce and Cerqueira Maria
Bought by
Ruiz Alejandro and Ruiz Ariadna
Current Estimated Value
Home Financials for this Owner
Home Financials are based on the most recent Mortgage that was taken out on this home.
Original Mortgage
$295,000
Outstanding Balance
$281,565
Interest Rate
5.13%
Mortgage Type
New Conventional
Estimated Equity
$122,703
Purchase Details
Closed on
Aug 29, 2017
Sold by
Fabrizio Peter
Bought by
Cerqueira Jose
Create a Home Valuation Report for This Property
The Home Valuation Report is an in-depth analysis detailing your home's value as well as a comparison with similar homes in the area
Home Values in the Area
Average Home Value in this Area
Purchase History
| Date | Buyer | Sale Price | Title Company |
|---|---|---|---|
| Ruiz Alejandro | $325,000 | Misc Company | |
| Ruiz Alejandro | $325,000 | Misc Company | |
| Cerqueira Jose | $165,000 | -- | |
| Cerqueira Jose | $165,000 | -- |
Source: Public Records
Mortgage History
| Date | Status | Borrower | Loan Amount |
|---|---|---|---|
| Open | Ruiz Alejandro | $295,000 | |
| Closed | Ruiz Alejandro | $295,000 |
Source: Public Records
Tax History
| Year | Tax Paid | Tax Assessment Tax Assessment Total Assessment is a certain percentage of the fair market value that is determined by local assessors to be the total taxable value of land and additions on the property. | Land | Improvement |
|---|---|---|---|---|
| 2024 | $8,711 | $344,500 | $54,000 | $290,500 |
| 2023 | $8,106 | $325,000 | $54,000 | $271,000 |
| 2022 | $6,989 | $276,700 | $54,000 | $222,700 |
| 2021 | $6,797 | $228,700 | $54,000 | $174,700 |
| 2020 | $6,094 | $190,600 | $54,000 | $136,600 |
| 2019 | $5,901 | $173,300 | $54,000 | $119,300 |
| 2018 | $5,693 | $165,000 | $54,000 | $111,000 |
| 2017 | $4,904 | $138,800 | $54,000 | $84,800 |
| 2016 | $4,805 | $143,100 | $54,000 | $89,100 |
| 2015 | -- | $143,100 | $54,000 | $89,100 |
| 2014 | -- | $143,100 | $54,000 | $89,100 |
Source: Public Records
Map
Nearby Homes
- 65 Worrall Ave
- 409 Baker St
- 46 Fountain Place
- 29 Lewis Ave
- 31 Wilson Blvd
- 25 Park Ave
- 19 Maryland Ave
- 6 Glenwood Ave
- 39 Innis Ave
- 7 Gray St
- 274 Hooker Ave Unit L2
- 24 Jewett Ave
- 171 Hooker Ave
- 324-326 Church St
- 7 Ferris Ln
- 13 Parkwood Blvd
- 176 S Grand Ave
- 17 Hammersley Ave
- 113 Hooker Ave
- 88 Innis Ave
Your Personal Tour Guide
Ask me questions while you tour the home.