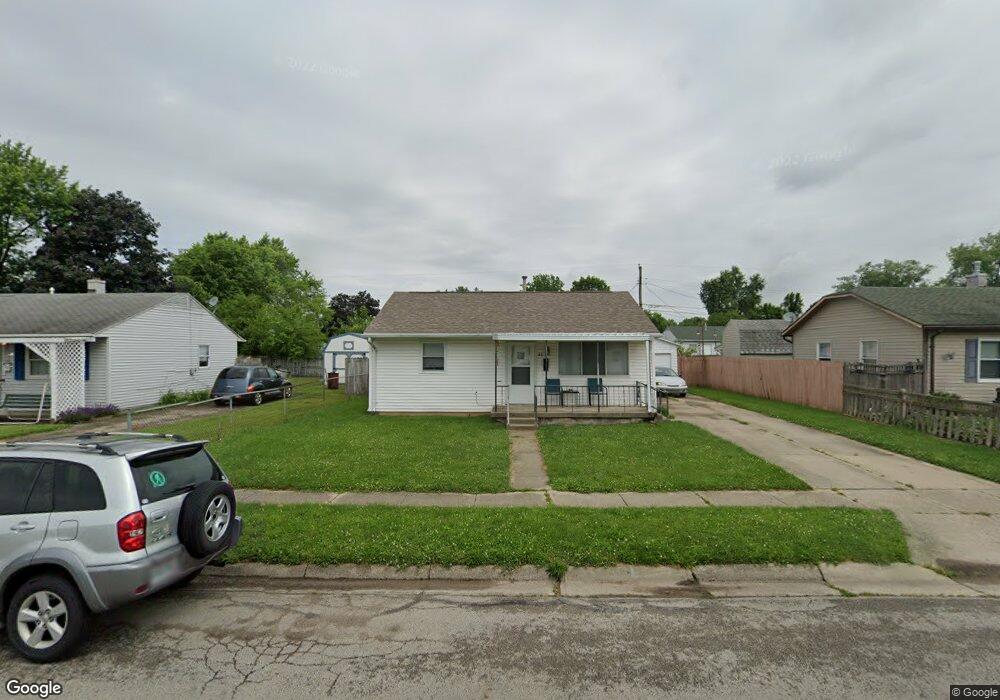
43 Galewood Dr Fairborn, OH 45324
Estimated Value: $104,000 - $133,000
2
Beds
1
Bath
744
Sq Ft
$162/Sq Ft
Est. Value
About This Home
This home is located at 43 Galewood Dr, Fairborn, OH 45324 and is currently estimated at $120,768, approximately $162 per square foot. 43 Galewood Dr is a home located in Greene County with nearby schools including Fairborn Primary School, Fairborn Intermediate School, and Fairborn Middle School.
Ownership History
Date
Name
Owned For
Owner Type
Purchase Details
Closed on
Sep 27, 2018
Sold by
Mary E Brown Properties I Llc
Bought by
Lamont Carroll Group Ii Llc
Current Estimated Value
Home Financials for this Owner
Home Financials are based on the most recent Mortgage that was taken out on this home.
Original Mortgage
$3,697,500
Outstanding Balance
$3,224,440
Interest Rate
4.5%
Mortgage Type
Commercial
Estimated Equity
-$3,103,672
Purchase Details
Closed on
May 9, 1995
Sold by
Shrf George R Eddy Pr
Bought by
Grover and Grover Brown E
Create a Home Valuation Report for This Property
The Home Valuation Report is an in-depth analysis detailing your home's value as well as a comparison with similar homes in the area
Home Values in the Area
Average Home Value in this Area
Purchase History
| Date | Buyer | Sale Price | Title Company |
|---|---|---|---|
| Lamont Carroll Group Ii Llc | -- | None Available | |
| Grover | $42,900 | -- |
Source: Public Records
Mortgage History
| Date | Status | Borrower | Loan Amount |
|---|---|---|---|
| Open | Lamont Carroll Group Ii Llc | $3,697,500 |
Source: Public Records
Tax History Compared to Growth
Tax History
| Year | Tax Paid | Tax Assessment Tax Assessment Total Assessment is a certain percentage of the fair market value that is determined by local assessors to be the total taxable value of land and additions on the property. | Land | Improvement |
|---|---|---|---|---|
| 2024 | $1,551 | $30,840 | $8,090 | $22,750 |
| 2023 | $1,477 | $30,840 | $8,090 | $22,750 |
| 2022 | $1,145 | $20,120 | $5,780 | $14,340 |
| 2021 | $1,161 | $20,120 | $5,780 | $14,340 |
| 2020 | $1,167 | $20,120 | $5,780 | $14,340 |
| 2019 | $1,017 | $17,550 | $5,800 | $11,750 |
| 2018 | $1,028 | $17,550 | $5,800 | $11,750 |
| 2017 | $649 | $17,550 | $5,800 | $11,750 |
| 2016 | $1,030 | $17,570 | $5,800 | $11,770 |
| 2015 | $982 | $17,570 | $5,800 | $11,770 |
| 2014 | $950 | $17,570 | $5,800 | $11,770 |
Source: Public Records
Map
Nearby Homes
- 849 Flintridge Dr
- 5 Marchmont Dr
- 97 Marchmont Dr
- 3 Holgate Ct
- 608 S Maple Ave
- 849 S Maple Ave
- 869 S Maple Ave
- 852 Princeton Ave
- 849 Princeton Ave
- 20 Ramona Dr
- 860 Washington Ave
- 43 Lindway Dr
- 1108 Lexington Ave
- 44 Brockway Ct
- 1040 S Central Ave
- 1121 Lexington Ave
- 66 S Central Ave
- 139 Hower Ln
- 320 E Xenia Dr
- 1033 Victoria Ave