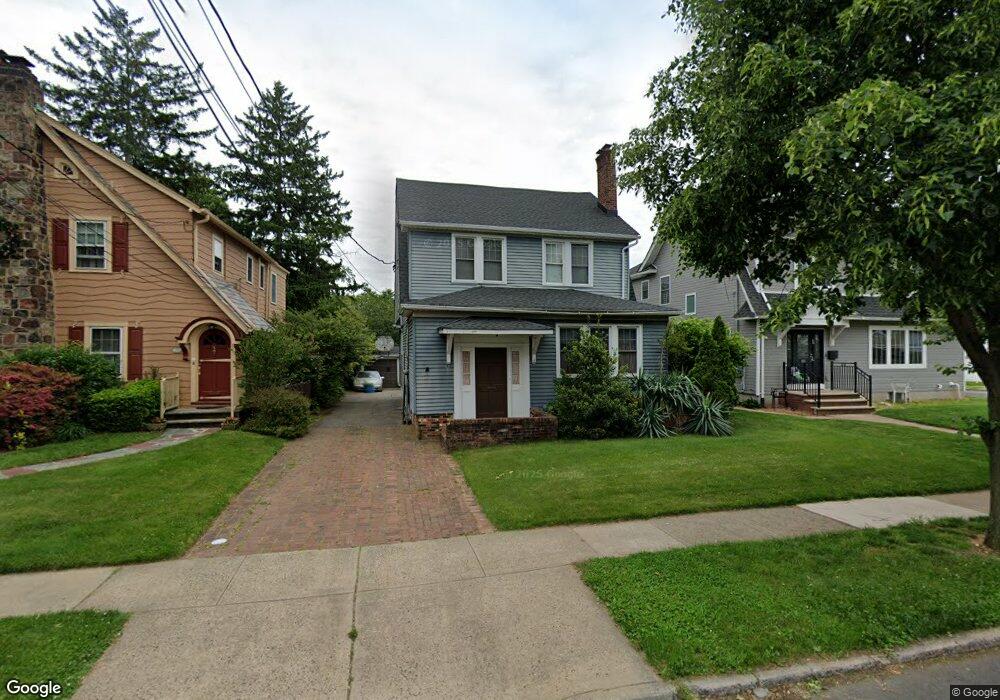
43 Gesner St Linden, NJ 07036
Estimated Value: $464,000 - $573,000
--
Bed
--
Bath
894
Sq Ft
$584/Sq Ft
Est. Value
About This Home
This home is located at 43 Gesner St, Linden, NJ 07036 and is currently estimated at $522,098, approximately $584 per square foot. 43 Gesner St is a home located in Union County with nearby schools including Number 1, Myles J. McManus Middle School, and Linden High School.
Ownership History
Date
Name
Owned For
Owner Type
Purchase Details
Closed on
Sep 4, 2014
Sold by
Sibilia Marie Josee
Bought by
Dunbar Harry
Current Estimated Value
Purchase Details
Closed on
Oct 6, 1998
Sold by
Gilligan James B and Gilligan Catherine M
Bought by
Dunbar Harry
Home Financials for this Owner
Home Financials are based on the most recent Mortgage that was taken out on this home.
Original Mortgage
$151,330
Interest Rate
6.92%
Mortgage Type
FHA
Create a Home Valuation Report for This Property
The Home Valuation Report is an in-depth analysis detailing your home's value as well as a comparison with similar homes in the area
Home Values in the Area
Average Home Value in this Area
Purchase History
| Date | Buyer | Sale Price | Title Company |
|---|---|---|---|
| Dunbar Harry | $53,750 | None Available | |
| Dunbar Harry | $153,000 | -- |
Source: Public Records
Mortgage History
| Date | Status | Borrower | Loan Amount |
|---|---|---|---|
| Previous Owner | Dunbar Harry | $151,330 |
Source: Public Records
Tax History Compared to Growth
Tax History
| Year | Tax Paid | Tax Assessment Tax Assessment Total Assessment is a certain percentage of the fair market value that is determined by local assessors to be the total taxable value of land and additions on the property. | Land | Improvement |
|---|---|---|---|---|
| 2025 | $9,599 | $136,500 | $54,300 | $82,200 |
| 2024 | $9,388 | $136,500 | $54,300 | $82,200 |
| 2023 | $9,388 | $136,500 | $54,300 | $82,200 |
| 2022 | $9,438 | $136,500 | $54,300 | $82,200 |
| 2021 | $9,485 | $136,500 | $54,300 | $82,200 |
| 2020 | $9,435 | $136,500 | $54,300 | $82,200 |
| 2019 | $9,403 | $136,500 | $54,300 | $82,200 |
| 2018 | $9,401 | $136,500 | $54,300 | $82,200 |
| 2017 | $9,197 | $136,500 | $54,300 | $82,200 |
| 2016 | $8,908 | $136,500 | $54,300 | $82,200 |
| 2015 | $8,568 | $136,500 | $54,300 | $82,200 |
| 2014 | $8,402 | $136,500 | $54,300 | $82,200 |
Source: Public Records
Map
Nearby Homes
- 106 W Gibbons St
- 813 N Wood Ave
- 725 N Wood Ave
- 721 N Wood Ave
- 925 Summit St
- 906 Dewitt St
- 717 Summit St
- 905 Dewitt St
- 315 Gesner St
- 1210 Orchard Terrace
- 2209 N Wood Ave
- 402 W Gibbons St
- 600 W Henry St
- 30 E Henry St
- 559 Uncas Ave
- 812 Washington Ave
- 428 Brook St
- 435 Miner Terrace
- 222 Yale Terrace
- 706 Lindegar St