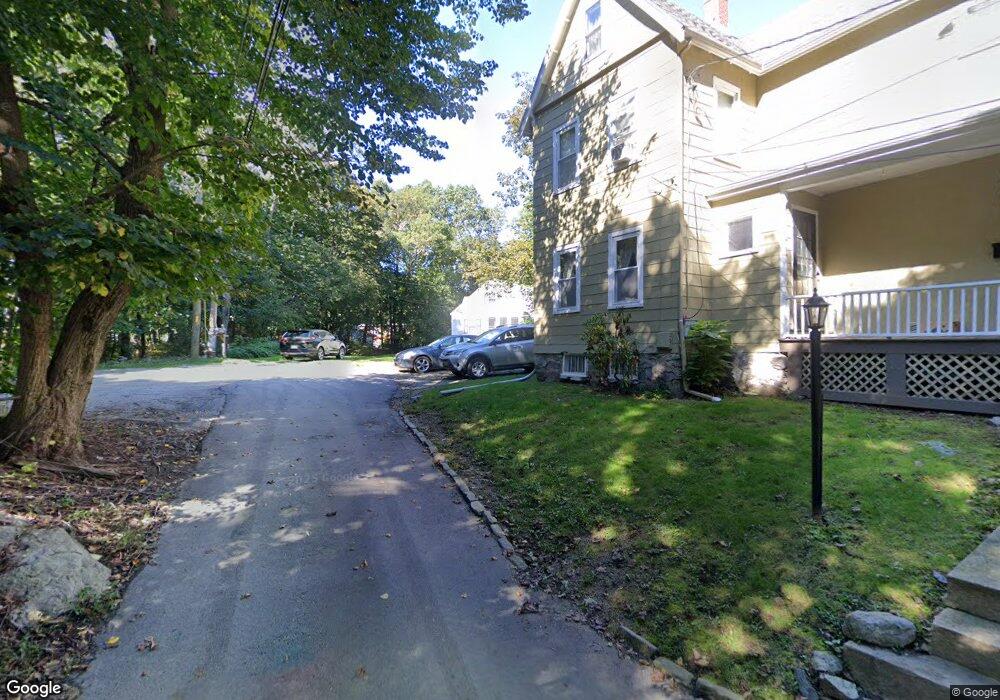
43 Glancy Ln Dedham, MA 02026
East Dedham NeighborhoodEstimated Value: $664,137 - $799,000
3
Beds
1
Bath
1,414
Sq Ft
$505/Sq Ft
Est. Value
About This Home
This home is located at 43 Glancy Ln, Dedham, MA 02026 and is currently estimated at $714,034, approximately $504 per square foot. 43 Glancy Ln is a home located in Norfolk County with nearby schools including Avery, Dedham Middle School, and Dedham High School.
Ownership History
Date
Name
Owned For
Owner Type
Purchase Details
Closed on
Aug 18, 2017
Sold by
Lee Ft
Bought by
Roche Jeremy
Current Estimated Value
Home Financials for this Owner
Home Financials are based on the most recent Mortgage that was taken out on this home.
Original Mortgage
$392,755
Outstanding Balance
$326,925
Interest Rate
3.87%
Mortgage Type
FHA
Estimated Equity
$387,109
Purchase Details
Closed on
Feb 19, 1999
Sold by
Biggar Douglas A
Bought by
Lee David J and Lee Pamela J
Create a Home Valuation Report for This Property
The Home Valuation Report is an in-depth analysis detailing your home's value as well as a comparison with similar homes in the area
Home Values in the Area
Average Home Value in this Area
Purchase History
| Date | Buyer | Sale Price | Title Company |
|---|---|---|---|
| Roche Jeremy | $400,000 | -- | |
| Lee David J | $123,000 | -- |
Source: Public Records
Mortgage History
| Date | Status | Borrower | Loan Amount |
|---|---|---|---|
| Open | Roche Jeremy | $392,755 |
Source: Public Records
Tax History Compared to Growth
Tax History
| Year | Tax Paid | Tax Assessment Tax Assessment Total Assessment is a certain percentage of the fair market value that is determined by local assessors to be the total taxable value of land and additions on the property. | Land | Improvement |
|---|---|---|---|---|
| 2025 | $6,888 | $545,800 | $287,700 | $258,100 |
| 2024 | $6,898 | $551,800 | $272,500 | $279,300 |
| 2023 | $6,437 | $501,300 | $241,900 | $259,400 |
| 2022 | $6,180 | $462,900 | $236,700 | $226,200 |
| 2021 | $5,814 | $425,300 | $231,700 | $193,600 |
| 2020 | $5,668 | $413,100 | $221,400 | $191,700 |
| 2019 | $5,251 | $371,100 | $192,600 | $178,500 |
| 2018 | $5,005 | $344,000 | $170,600 | $173,400 |
| 2017 | $4,921 | $333,400 | $160,000 | $173,400 |
| 2016 | $4,659 | $300,800 | $139,900 | $160,900 |
| 2015 | $4,475 | $282,000 | $136,200 | $145,800 |
| 2014 | $4,472 | $278,100 | $133,100 | $145,000 |
Source: Public Records
Map
Nearby Homes
- 94 Rockland St
- 70 Birchwood St
- 83 Mount Hope St
- 25R Rockland St Unit 6
- 235 Curve St
- 11 Cheriton Rd Unit 102B
- 69 Berlin St
- 19 Lewis Ln
- 108 High St
- 40 Unit 207
- 150 Grove St
- 42 Churchill Place
- 8 Fort Ln
- 199 Glenellen Rd
- 56 Mount Vernon St
- 191 Glenellen Rd
- 2 Cocci Way
- 38 Fleming St
- 115 Grove St Unit 11
- 111 Grove St Unit 6
- 39 Goethe Place
- 0 Carrolton
- 29 Glancy Ln
- 50 Goethe Place
- 56 Carrolton Rd
- 45 Goethe St
- 14 Carrolton Ln
- 59 Carrolton Ln
- 63 Clisby Ave
- 40 Goethe St
- 115 Rockland St
- 107 Rockland St
- 73 Sunset Ave
- 109 Rockland St Unit 1
- 109 Rockland St
- 67 Clisby Ave
- 48 Carrolton Rd
- 57 Carrolton Rd
- 81 Sunset Ave
- 105 Rockland St