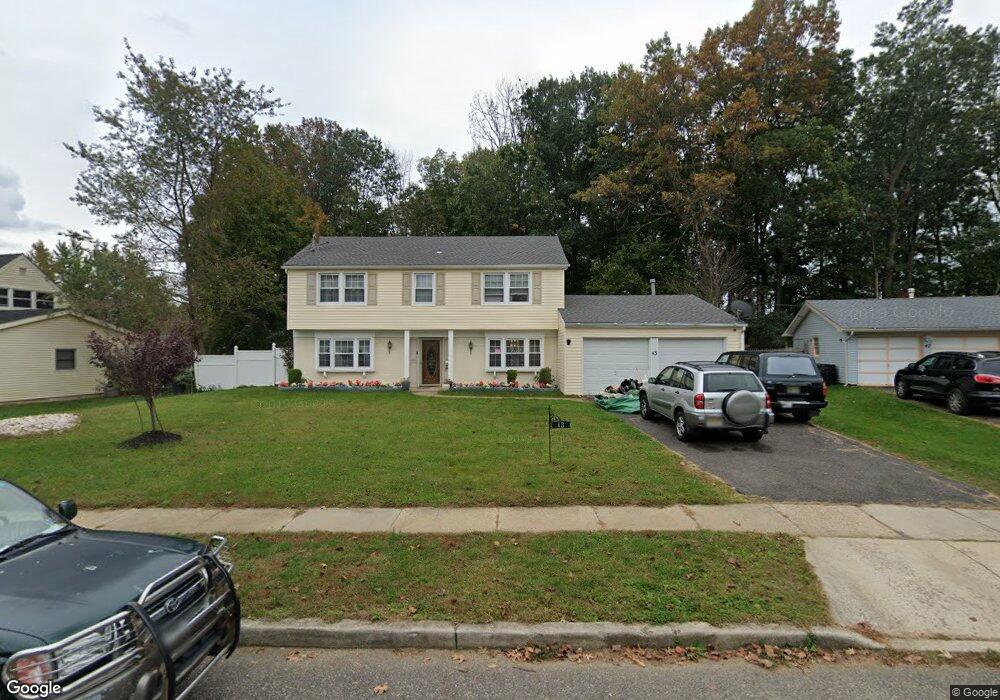
43 Glover Ln Willingboro, NJ 08046
Estimated Value: $368,000 - $409,000
--
Bed
--
Bath
1,959
Sq Ft
$197/Sq Ft
Est. Value
About This Home
This home is located at 43 Glover Ln, Willingboro, NJ 08046 and is currently estimated at $384,960, approximately $196 per square foot. 43 Glover Ln is a home located in Burlington County with nearby schools including Twin Hills Elementary School, Memorial Middle School, and Levitt Intermediate School.
Ownership History
Date
Name
Owned For
Owner Type
Purchase Details
Closed on
May 9, 2023
Sold by
Philippe Gabriel Jean
Bought by
Fils Jean-Philippe and Mondel Jean-Philippe
Current Estimated Value
Purchase Details
Closed on
Oct 31, 2019
Sold by
Jean Phillippe Fils and Jean Phillippe Marie
Bought by
Jean Philippe Marie
Purchase Details
Closed on
May 28, 2004
Sold by
Mcintyre James and Mcintyre Amery A
Bought by
Philippe Fils Jean and Philippe Marie Jean
Create a Home Valuation Report for This Property
The Home Valuation Report is an in-depth analysis detailing your home's value as well as a comparison with similar homes in the area
Home Values in the Area
Average Home Value in this Area
Purchase History
| Date | Buyer | Sale Price | Title Company |
|---|---|---|---|
| Fils Jean-Philippe | -- | None Listed On Document | |
| Jean-Philippe Fils | -- | None Listed On Document | |
| Jean Philippe Marie | -- | Pro National Title Agcy Llc | |
| Philippe Fils Jean | $215,000 | Chicago Title Insurance Co |
Source: Public Records
Tax History Compared to Growth
Tax History
| Year | Tax Paid | Tax Assessment Tax Assessment Total Assessment is a certain percentage of the fair market value that is determined by local assessors to be the total taxable value of land and additions on the property. | Land | Improvement |
|---|---|---|---|---|
| 2025 | $7,123 | $165,000 | $34,400 | $130,600 |
| 2024 | $7,070 | $165,000 | $34,400 | $130,600 |
| 2023 | $7,070 | $165,000 | $34,400 | $130,600 |
| 2022 | $6,582 | $165,000 | $34,400 | $130,600 |
| 2021 | $6,593 | $165,000 | $34,400 | $130,600 |
| 2020 | $6,621 | $165,000 | $34,400 | $130,600 |
| 2019 | $6,559 | $165,000 | $34,400 | $130,600 |
| 2018 | $6,437 | $165,000 | $34,400 | $130,600 |
| 2017 | $6,257 | $165,000 | $34,400 | $130,600 |
| 2016 | $6,446 | $171,700 | $34,400 | $137,300 |
| 2015 | $6,224 | $171,700 | $34,400 | $137,300 |
| 2014 | $5,925 | $171,700 | $34,400 | $137,300 |
Source: Public Records
Map
Nearby Homes