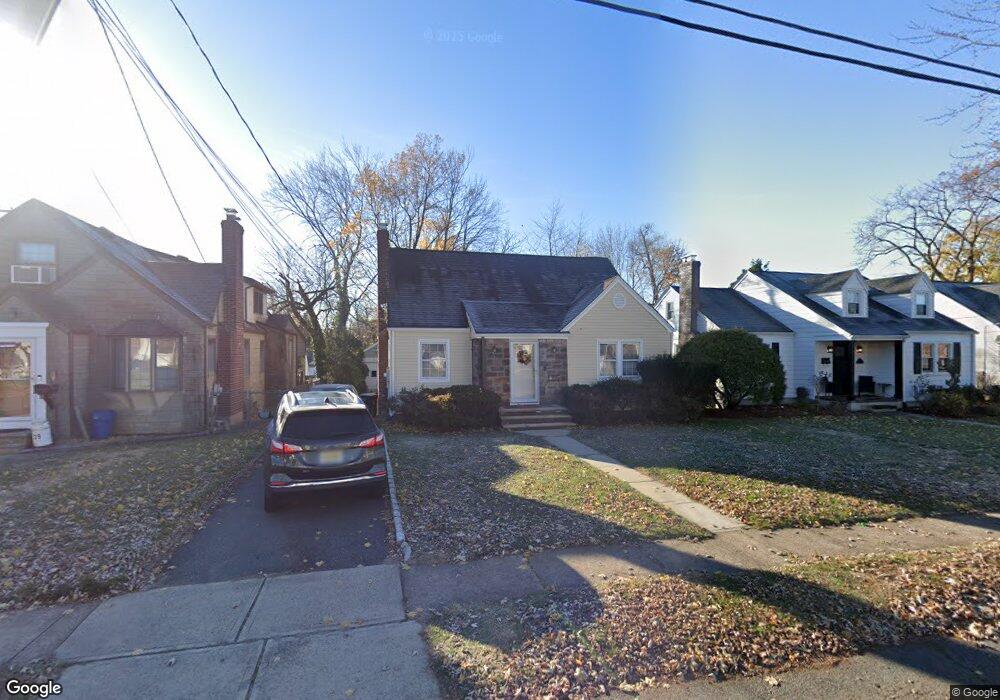
43 Gordon Ave Dumont, NJ 07628
Estimated Value: $590,000 - $675,000
Studio
--
Bath
1,585
Sq Ft
$407/Sq Ft
Est. Value
About This Home
This home is located at 43 Gordon Ave, Dumont, NJ 07628 and is currently estimated at $645,285, approximately $407 per square foot. 43 Gordon Ave is a home located in Bergen County with nearby schools including Dumont High School.
Ownership History
Date
Name
Owned For
Owner Type
Purchase Details
Closed on
Jun 13, 2011
Sold by
Kazinci Thomas J and Murphy Kazinci Ericka L
Bought by
Mcgee Joseph and Mcgee Theresa
Current Estimated Value
Home Financials for this Owner
Home Financials are based on the most recent Mortgage that was taken out on this home.
Original Mortgage
$342,541
Outstanding Balance
$237,796
Interest Rate
4.78%
Mortgage Type
FHA
Estimated Equity
$407,489
Purchase Details
Closed on
May 5, 1999
Sold by
Doyle Kevin and Doyle Madelynne
Bought by
Kazinci Thomas J and Murphy Aricka Lee
Home Financials for this Owner
Home Financials are based on the most recent Mortgage that was taken out on this home.
Original Mortgage
$165,600
Interest Rate
6.88%
Mortgage Type
Stand Alone First
Create a Home Valuation Report for This Property
The Home Valuation Report is an in-depth analysis detailing your home's value as well as a comparison with similar homes in the area
Home Values in the Area
Average Home Value in this Area
Purchase History
| Date | Buyer | Sale Price | Title Company |
|---|---|---|---|
| Mcgee Joseph | $357,000 | -- | |
| Kazinci Thomas J | $184,000 | First American Title Ins Co |
Source: Public Records
Mortgage History
| Date | Status | Borrower | Loan Amount |
|---|---|---|---|
| Open | Mcgee Joseph | $342,541 | |
| Previous Owner | Kazinci Thomas J | $165,600 |
Source: Public Records
Tax History
| Year | Tax Paid | Tax Assessment Tax Assessment Total Assessment is a certain percentage of the fair market value that is determined by local assessors to be the total taxable value of land and additions on the property. | Land | Improvement |
|---|---|---|---|---|
| 2025 | $13,520 | $535,900 | $294,000 | $241,900 |
| 2024 | $13,188 | $332,600 | $167,500 | $165,100 |
| 2023 | $12,915 | $332,600 | $167,500 | $165,100 |
| 2022 | $12,915 | $332,600 | $167,500 | $165,100 |
| 2021 | $12,852 | $332,600 | $167,500 | $165,100 |
| 2020 | $12,502 | $332,600 | $167,500 | $165,100 |
| 2019 | $12,203 | $332,600 | $167,500 | $165,100 |
| 2018 | $11,954 | $332,600 | $167,500 | $165,100 |
| 2017 | $11,724 | $332,600 | $167,500 | $165,100 |
| 2016 | $11,451 | $332,600 | $167,500 | $165,100 |
| 2015 | $11,189 | $332,600 | $167,500 | $165,100 |
| 2014 | $10,969 | $332,600 | $167,500 | $165,100 |
Source: Public Records
Map
Nearby Homes
- 82 Cresskill Ave
- 211 Bedford Rd
- 42 Lenox Ave
- 156 E Linden Ave
- 19 Bedford Rd
- 144 New Milford Ave
- 79 Blauvelt Ave
- 95 W Shore Ave
- 7 Overlook Dr
- 455 Sunset Ave
- 496 Prospect Ave
- 502 Prospect Ave
- 28 Park Ave
- 592 Fermery Dr
- 28 Niagara St
- 627 Concord St
- 45 Merritt Dr
- 40 Depew St
- 74 Shadyside Ave
- 201 Dixon Ave
Your Personal Tour Guide
Ask me questions while you tour the home.