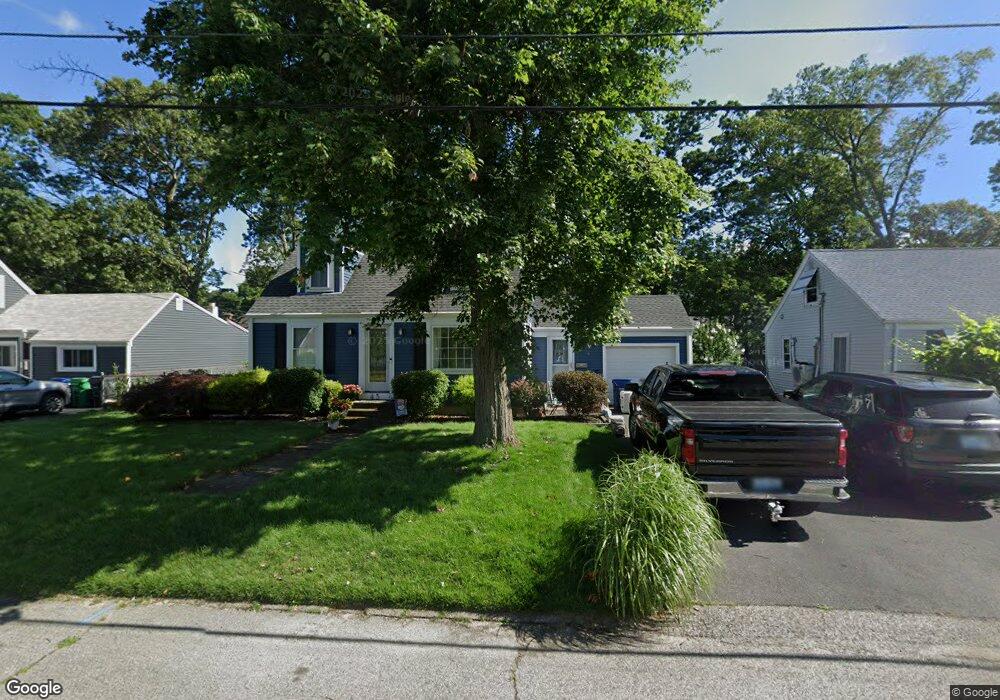
43 Guilford Dr Warwick, RI 02886
Hillsgrove NeighborhoodEstimated Value: $353,000 - $388,000
4
Beds
1
Bath
1,100
Sq Ft
$337/Sq Ft
Est. Value
About This Home
This home is located at 43 Guilford Dr, Warwick, RI 02886 and is currently estimated at $370,793, approximately $337 per square foot. 43 Guilford Dr is a home located in Kent County with nearby schools including Nel/Cps Construction Career and St Rose Of Lima School.
Ownership History
Date
Name
Owned For
Owner Type
Purchase Details
Closed on
Dec 7, 2005
Sold by
Bezak John M
Bought by
Coleman Scott C and Coleman Christina M
Current Estimated Value
Home Financials for this Owner
Home Financials are based on the most recent Mortgage that was taken out on this home.
Original Mortgage
$190,000
Interest Rate
6.17%
Mortgage Type
Purchase Money Mortgage
Purchase Details
Closed on
Dec 13, 2002
Sold by
Roy Ronald W and Roy Vicki-Ann
Bought by
Bezak John M
Create a Home Valuation Report for This Property
The Home Valuation Report is an in-depth analysis detailing your home's value as well as a comparison with similar homes in the area
Home Values in the Area
Average Home Value in this Area
Purchase History
| Date | Buyer | Sale Price | Title Company |
|---|---|---|---|
| Coleman Scott C | $238,000 | -- | |
| Bezak John M | $165,000 | -- |
Source: Public Records
Mortgage History
| Date | Status | Borrower | Loan Amount |
|---|---|---|---|
| Open | Bezak John M | $171,427 | |
| Closed | Bezak John M | $190,000 | |
| Closed | Bezak John M | $35,625 |
Source: Public Records
Tax History Compared to Growth
Tax History
| Year | Tax Paid | Tax Assessment Tax Assessment Total Assessment is a certain percentage of the fair market value that is determined by local assessors to be the total taxable value of land and additions on the property. | Land | Improvement |
|---|---|---|---|---|
| 2025 | $4,197 | $330,500 | $101,800 | $228,700 |
| 2024 | $3,989 | $275,700 | $88,500 | $187,200 |
| 2023 | $3,912 | $275,700 | $88,500 | $187,200 |
| 2022 | $3,725 | $198,900 | $57,700 | $141,200 |
| 2021 | $3,725 | $198,900 | $57,700 | $141,200 |
| 2020 | $3,725 | $198,900 | $57,700 | $141,200 |
| 2019 | $3,725 | $198,900 | $57,700 | $141,200 |
| 2018 | $3,291 | $158,200 | $57,700 | $100,500 |
| 2017 | $3,202 | $158,200 | $57,700 | $100,500 |
| 2016 | $3,202 | $158,200 | $57,700 | $100,500 |
| 2015 | $2,893 | $139,400 | $56,700 | $82,700 |
| 2014 | $2,796 | $139,400 | $56,700 | $82,700 |
| 2013 | $2,729 | $137,900 | $56,700 | $81,200 |
Source: Public Records
Map
Nearby Homes
- 77 Kentucky Ave
- 76 Massachusetts Ave
- 93 Grotto Ave
- 396 Elm St
- 85 Pilgrim Dr
- 142 Edaville Ct
- 1153 Post Rd
- 63 Massasoit Dr
- 1002 Williamsburg Cir
- 106 Palace Ave
- 995 Williamsburg Cir
- 401 Lake Shore Dr
- 169 Partition St
- 765 Williamsburg Cir
- 170 Calderwood Dr
- 447 Harrington Ave
- 418 Lake Shore Dr
- 33 Samuel Ct
- 144 Hoxsie Ave
- 10 East St Unit 316