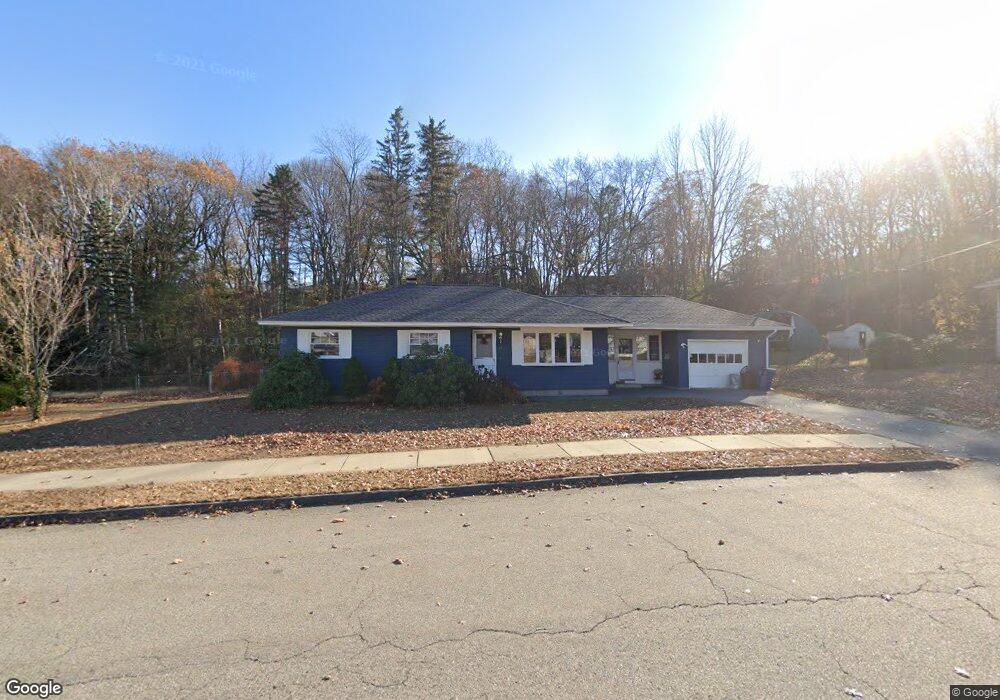
43 Hamlet St Lawrence, MA 01843
Mount Vernon NeighborhoodEstimated Value: $539,000 - $569,221
3
Beds
2
Baths
1,370
Sq Ft
$400/Sq Ft
Est. Value
About This Home
This home is located at 43 Hamlet St, Lawrence, MA 01843 and is currently estimated at $548,555, approximately $400 per square foot. 43 Hamlet St is a home located in Essex County with nearby schools including John Breen School, School For Exceptional Studies, and Robert Frost Middle School.
Ownership History
Date
Name
Owned For
Owner Type
Purchase Details
Closed on
Dec 22, 2017
Sold by
Pazmino Julio
Bought by
Pazmino Julio and Pazmino Jomary
Current Estimated Value
Purchase Details
Closed on
May 21, 2010
Sold by
Gosselin Eric J and Gosselin Dawn M
Bought by
Pazmino Julio
Home Financials for this Owner
Home Financials are based on the most recent Mortgage that was taken out on this home.
Original Mortgage
$233,197
Interest Rate
5.5%
Mortgage Type
FHA
Purchase Details
Closed on
Mar 7, 2000
Sold by
Lavallee Mark G and Lavallee Molly C
Bought by
Gosselin Eric J and Young Dawn M
Home Financials for this Owner
Home Financials are based on the most recent Mortgage that was taken out on this home.
Original Mortgage
$123,400
Interest Rate
8.21%
Mortgage Type
Purchase Money Mortgage
Purchase Details
Closed on
Aug 30, 1993
Sold by
Casey James A
Bought by
Lavallee Mark G
Create a Home Valuation Report for This Property
The Home Valuation Report is an in-depth analysis detailing your home's value as well as a comparison with similar homes in the area
Home Values in the Area
Average Home Value in this Area
Purchase History
| Date | Buyer | Sale Price | Title Company |
|---|---|---|---|
| Pazmino Julio | -- | -- | |
| Pazmino Julio | $237,500 | -- | |
| Gosselin Eric J | $129,900 | -- | |
| Lavallee Mark G | $107,000 | -- |
Source: Public Records
Mortgage History
| Date | Status | Borrower | Loan Amount |
|---|---|---|---|
| Previous Owner | Pazmino Julio | $233,197 | |
| Previous Owner | Lavallee Mark G | $109,000 | |
| Previous Owner | Lavallee Mark G | $125,000 | |
| Previous Owner | Lavallee Mark G | $123,400 |
Source: Public Records
Tax History
| Year | Tax Paid | Tax Assessment Tax Assessment Total Assessment is a certain percentage of the fair market value that is determined by local assessors to be the total taxable value of land and additions on the property. | Land | Improvement |
|---|---|---|---|---|
| 2025 | $4,310 | $489,800 | $197,600 | $292,200 |
| 2024 | $3,978 | $430,000 | $166,100 | $263,900 |
| 2023 | $4,198 | $413,200 | $166,100 | $247,100 |
| 2022 | $4,099 | $358,300 | $151,500 | $206,800 |
| 2021 | $3,898 | $317,700 | $148,400 | $169,300 |
| 2020 | $3,820 | $307,300 | $138,000 | $169,300 |
| 2019 | $3,713 | $271,400 | $120,600 | $150,800 |
| 2018 | $3,527 | $246,300 | $114,600 | $131,700 |
| 2017 | $3,425 | $223,300 | $109,200 | $114,100 |
| 2016 | $3,279 | $211,400 | $94,200 | $117,200 |
| 2015 | $3,196 | $211,400 | $94,200 | $117,200 |
Source: Public Records
Map
Nearby Homes
- 11 W Hawley St
- 87-87A Brookfield St
- 24 Inman St Unit 6
- 24 Inman St Unit 4
- 12B Stevens St
- 543 Andover St Unit 6
- 102 Weare St
- 341 S Broadway- Parcel II
- 35 Adams St
- 49 Bowdoin St Unit 51
- 91-93 Newton St
- 37 Tewksbury St Unit 39
- 0
- 31 Garfield St
- 12-12A Durham St
- 10 Dartmouth Rd
- 27-29 Dorchester St
- 21 Clubview Dr Unit 21
- 46-46A Dorchester St
- 356-360 S Union St
Your Personal Tour Guide
Ask me questions while you tour the home.