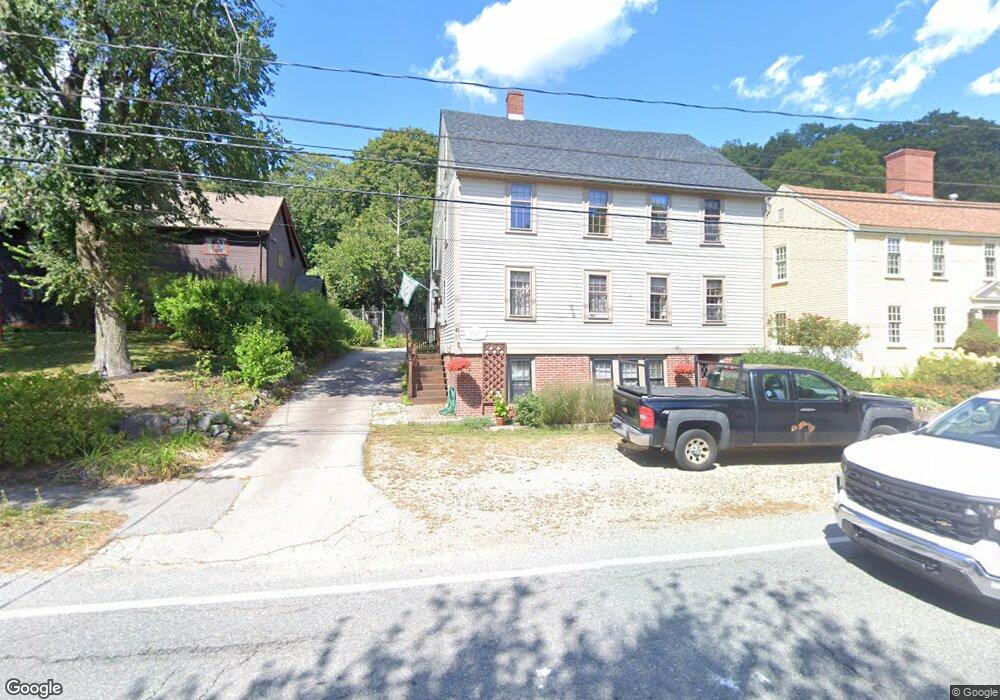
43 High St Ipswich, MA 01938
Estimated Value: $768,000 - $826,880
6
Beds
2
Baths
2,688
Sq Ft
$296/Sq Ft
Est. Value
About This Home
This home is located at 43 High St, Ipswich, MA 01938 and is currently estimated at $795,720, approximately $296 per square foot. 43 High St is a home located in Essex County with nearby schools including Ipswich High School and North Shore Montessori School.
Ownership History
Date
Name
Owned For
Owner Type
Purchase Details
Closed on
Mar 2, 2016
Sold by
Steele-Brancato Paula and Steele Matthew J
Bought by
Steele Matthew J and Steele-Brancato Paula
Current Estimated Value
Purchase Details
Closed on
Jan 27, 1988
Sold by
Miller Cary B
Bought by
Brancato Paula M
Create a Home Valuation Report for This Property
The Home Valuation Report is an in-depth analysis detailing your home's value as well as a comparison with similar homes in the area
Home Values in the Area
Average Home Value in this Area
Purchase History
| Date | Buyer | Sale Price | Title Company |
|---|---|---|---|
| Steele Matthew J | -- | -- | |
| Steele Matthew J | -- | -- | |
| Steele Matthew J | -- | -- | |
| Brancato Paula M | $240,000 | -- |
Source: Public Records
Mortgage History
| Date | Status | Borrower | Loan Amount |
|---|---|---|---|
| Previous Owner | Brancato Paula M | $129,200 | |
| Previous Owner | Brancato Paula M | $222,350 | |
| Previous Owner | Brancato Paula M | $216,600 |
Source: Public Records
Tax History Compared to Growth
Tax History
| Year | Tax Paid | Tax Assessment Tax Assessment Total Assessment is a certain percentage of the fair market value that is determined by local assessors to be the total taxable value of land and additions on the property. | Land | Improvement |
|---|---|---|---|---|
| 2025 | $7,822 | $701,500 | $269,500 | $432,000 |
| 2024 | $6,557 | $576,200 | $269,800 | $306,400 |
| 2023 | $6,564 | $536,700 | $230,300 | $306,400 |
| 2022 | $6,735 | $523,700 | $217,200 | $306,500 |
| 2021 | $6,746 | $510,300 | $213,900 | $296,400 |
| 2020 | $6,975 | $497,500 | $218,800 | $278,700 |
| 2019 | $6,870 | $487,600 | $208,900 | $278,700 |
| 2018 | $6,639 | $466,200 | $197,400 | $268,800 |
| 2017 | $6,546 | $461,300 | $187,500 | $273,800 |
| 2016 | $5,490 | $369,700 | $157,900 | $211,800 |
| 2015 | $4,950 | $366,400 | $154,600 | $211,800 |
Source: Public Records
Map
Nearby Homes
- 3 Soffron Ln Unit 2
- 11 Washington St
- 11 Washington St Unit 5
- 11 Washington St Unit 10
- 11 Washington St Unit 4
- 11 Washington St Unit 12
- 11 Washington St Unit Nine
- 0 Lanes End
- 59 Washington St
- 16 Appleton Park Unit F6
- 50-56 Market St
- 20 Summer St Unit 20
- 29 Summer St Unit 15
- 38 Kimball Ave Unit 5
- 16 Elm St
- 21 Brownville Ave
- 10 Olde Ipswich Way Unit E
- 22 Brownville Ave
- 128 High St Unit 4
- 12 1st St