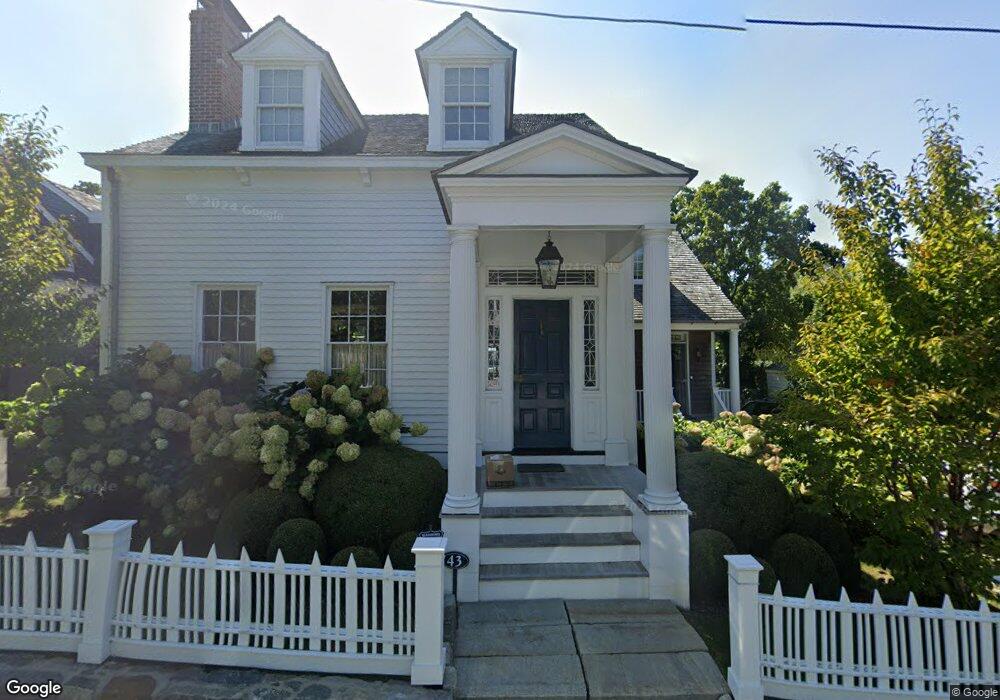
43 Howard St Sag Harbor, NY 11963
Estimated Value: $6,147,303 - $7,187,000
4
Beds
2
Baths
4,414
Sq Ft
$1,473/Sq Ft
Est. Value
About This Home
This home is located at 43 Howard St, Sag Harbor, NY 11963 and is currently estimated at $6,500,434, approximately $1,472 per square foot. 43 Howard St is a home located in Suffolk County with nearby schools including Sag Harbor Elementary School, Pierson Middle/High School, and Ross School.
Ownership History
Date
Name
Owned For
Owner Type
Purchase Details
Closed on
Jul 25, 2008
Sold by
Carlson Nancy Y
Bought by
Barr Steven R
Current Estimated Value
Home Financials for this Owner
Home Financials are based on the most recent Mortgage that was taken out on this home.
Original Mortgage
$500,000
Outstanding Balance
$330,731
Interest Rate
6.49%
Mortgage Type
Unknown
Estimated Equity
$6,169,703
Purchase Details
Closed on
Jul 23, 2008
Sold by
Carlson Nancy Y
Bought by
Barr Steven R
Home Financials for this Owner
Home Financials are based on the most recent Mortgage that was taken out on this home.
Original Mortgage
$500,000
Outstanding Balance
$330,731
Interest Rate
6.49%
Mortgage Type
Unknown
Estimated Equity
$6,169,703
Create a Home Valuation Report for This Property
The Home Valuation Report is an in-depth analysis detailing your home's value as well as a comparison with similar homes in the area
Home Values in the Area
Average Home Value in this Area
Purchase History
| Date | Buyer | Sale Price | Title Company |
|---|---|---|---|
| Barr Steven R | $1,130,000 | Dennis Downes | |
| Barr Steven R | $1,130,000 | Dennis Downes |
Source: Public Records
Mortgage History
| Date | Status | Borrower | Loan Amount |
|---|---|---|---|
| Open | Barr Steven R | $500,000 | |
| Closed | Barr Steven R | $404,000 |
Source: Public Records
Tax History Compared to Growth
Tax History
| Year | Tax Paid | Tax Assessment Tax Assessment Total Assessment is a certain percentage of the fair market value that is determined by local assessors to be the total taxable value of land and additions on the property. | Land | Improvement |
|---|---|---|---|---|
| 2024 | $14,739 | $5,306,300 | $1,062,700 | $4,243,600 |
| 2023 | $14,593 | $5,306,300 | $1,062,700 | $4,243,600 |
| 2022 | $14,408 | $5,306,300 | $1,062,700 | $4,243,600 |
| 2021 | $9,299 | $3,403,300 | $1,108,900 | $2,294,400 |
| 2020 | $13,450 | $3,403,300 | $1,108,900 | $2,294,400 |
| 2019 | $18,674 | $0 | $0 | $0 |
| 2018 | -- | $1,230,000 | $1,034,900 | $195,100 |
| 2017 | $6,083 | $1,058,700 | $924,100 | $134,600 |
| 2016 | $5,147 | $861,400 | $616,000 | $245,400 |
| 2015 | -- | $861,400 | $616,000 | $245,400 |
| 2014 | -- | $861,400 | $616,000 | $245,400 |
Source: Public Records
Map
Nearby Homes