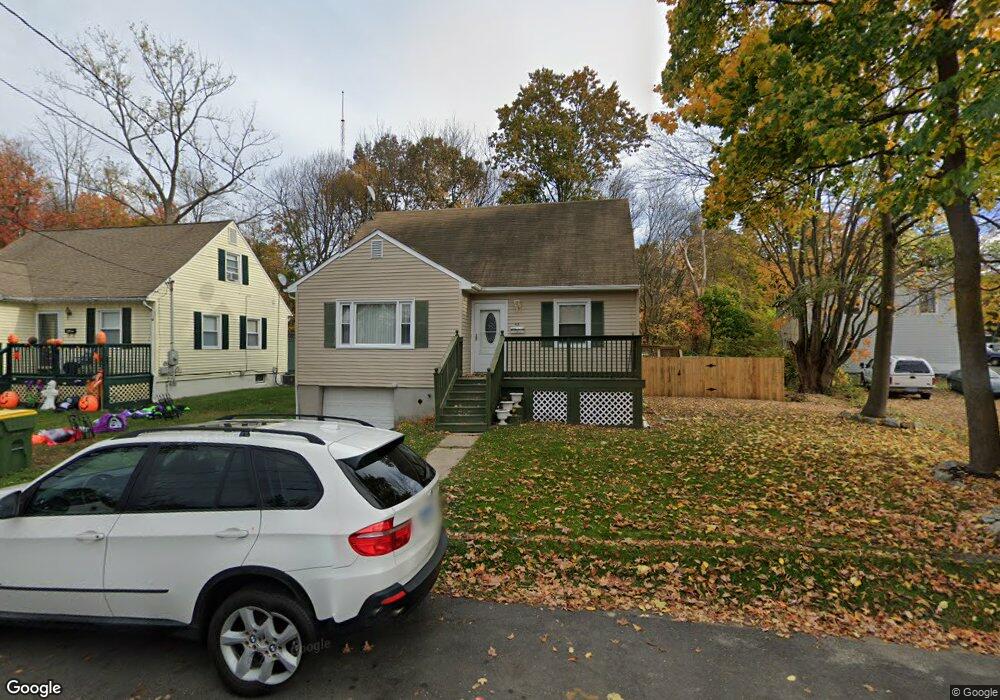
43 Hull St Waterbury, CT 06706
South End District NeighborhoodEstimated Value: $215,000 - $303,000
3
Beds
1
Bath
1,216
Sq Ft
$217/Sq Ft
Est. Value
About This Home
This home is located at 43 Hull St, Waterbury, CT 06706 and is currently estimated at $264,109, approximately $217 per square foot. 43 Hull St is a home located in New Haven County with nearby schools including Hopeville School, West Side Middle School, and John F. Kennedy High School.
Ownership History
Date
Name
Owned For
Owner Type
Purchase Details
Closed on
Jun 18, 1997
Sold by
Malaspina Steven and Malaspina Joseph A
Bought by
Martell Johnny
Current Estimated Value
Home Financials for this Owner
Home Financials are based on the most recent Mortgage that was taken out on this home.
Original Mortgage
$87,200
Outstanding Balance
$12,360
Interest Rate
7.87%
Mortgage Type
Purchase Money Mortgage
Estimated Equity
$251,749
Purchase Details
Closed on
Mar 19, 1996
Sold by
Collins Irene T
Bought by
Malaspina Steven and Pistritto Paul
Create a Home Valuation Report for This Property
The Home Valuation Report is an in-depth analysis detailing your home's value as well as a comparison with similar homes in the area
Home Values in the Area
Average Home Value in this Area
Purchase History
| Date | Buyer | Sale Price | Title Company |
|---|---|---|---|
| Martell Johnny | $89,500 | -- | |
| Malaspina Steven | $34,000 | -- |
Source: Public Records
Mortgage History
| Date | Status | Borrower | Loan Amount |
|---|---|---|---|
| Open | Malaspina Steven | $87,200 | |
| Closed | Malaspina Steven | $3,000 |
Source: Public Records
Tax History Compared to Growth
Tax History
| Year | Tax Paid | Tax Assessment Tax Assessment Total Assessment is a certain percentage of the fair market value that is determined by local assessors to be the total taxable value of land and additions on the property. | Land | Improvement |
|---|---|---|---|---|
| 2025 | $4,695 | $104,370 | $15,890 | $88,480 |
| 2024 | $5,160 | $104,370 | $15,890 | $88,480 |
| 2023 | $5,656 | $104,370 | $15,890 | $88,480 |
| 2022 | $3,736 | $62,050 | $15,890 | $46,160 |
| 2021 | $3,736 | $62,050 | $15,890 | $46,160 |
| 2020 | $3,736 | $62,050 | $15,890 | $46,160 |
| 2019 | $3,736 | $62,050 | $15,890 | $46,160 |
| 2018 | $3,736 | $62,050 | $15,890 | $46,160 |
| 2017 | $4,051 | $67,280 | $15,890 | $51,390 |
| 2016 | $4,051 | $67,280 | $15,890 | $51,390 |
| 2015 | $3,917 | $67,280 | $15,890 | $51,390 |
| 2014 | $3,917 | $67,280 | $15,890 | $51,390 |
Source: Public Records
Map
Nearby Homes
- 40 Laval St
- 41 Laval St
- 140 Edgewood Ave
- 127 Lounsbury St
- 0372 Floyd St
- 41L Floyd St
- 0039 Floyd St
- 439 Piedmont St
- 00 Milton Ave
- 51 Clover St
- 335 Raymond St
- 915 S Main St
- 562 Piedmont St
- 35 Mountain Village Rd Unit 30
- 463 Pearl Lake Rd
- 171 Kelsey St
- 73 Cornelius Ave
- 35 Pearl Lake Rd Unit B
- 146 Charles St
- 137 Greenmount Terrace