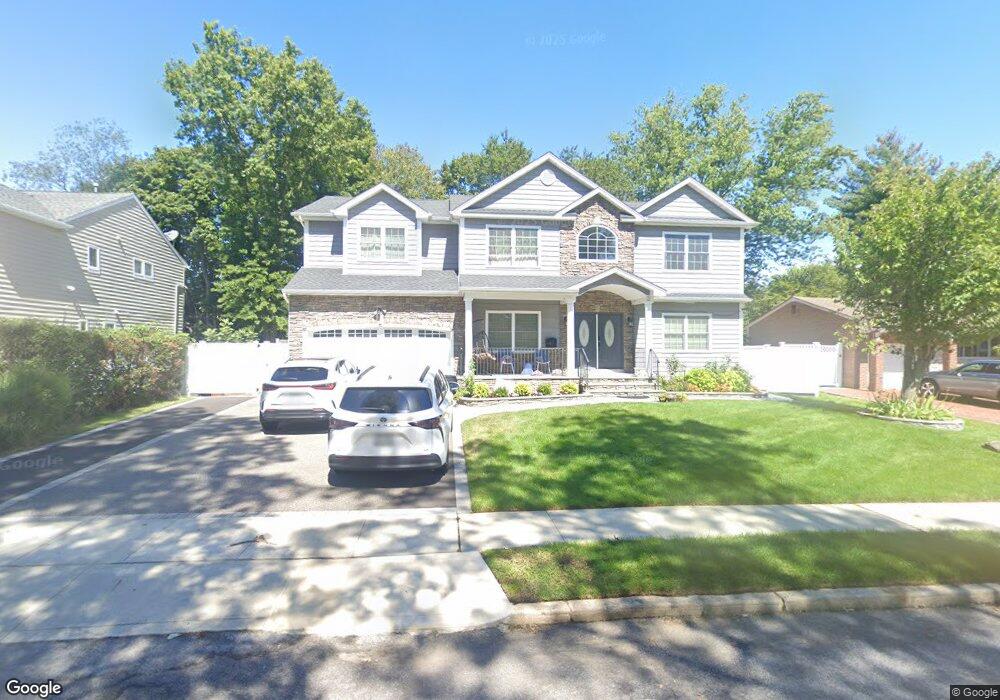
43 Ivy Dr Jericho, NY 11753
Estimated Value: $1,816,000 - $2,302,775
2
Beds
2
Baths
3,145
Sq Ft
$664/Sq Ft
Est. Value
About This Home
This home is located at 43 Ivy Dr, Jericho, NY 11753 and is currently estimated at $2,087,444, approximately $663 per square foot. 43 Ivy Dr is a home located in Nassau County with nearby schools including Jericho Middle School, Jericho Senior High School, and Trinity Lutheran School.
Ownership History
Date
Name
Owned For
Owner Type
Purchase Details
Closed on
Aug 25, 2023
Sold by
Zhu Yunzhang and Wang Meizhi
Bought by
Zhu Yunzhang and Wang Meizhi
Current Estimated Value
Purchase Details
Closed on
Jun 21, 2019
Sold by
Stylux Homes Inc
Bought by
Zhu Yunzhang and Wang Meizhi
Home Financials for this Owner
Home Financials are based on the most recent Mortgage that was taken out on this home.
Original Mortgage
$949,900
Outstanding Balance
$826,439
Interest Rate
4%
Mortgage Type
Adjustable Rate Mortgage/ARM
Estimated Equity
$1,261,005
Purchase Details
Closed on
Sep 28, 2017
Sold by
Hamerman Randy and Hamerman Felicia
Bought by
Stylux Homes Inc
Purchase Details
Closed on
Aug 17, 1995
Sold by
Simon Sandra
Bought by
Hamerman Randy and Hamerman Felicia
Create a Home Valuation Report for This Property
The Home Valuation Report is an in-depth analysis detailing your home's value as well as a comparison with similar homes in the area
Home Values in the Area
Average Home Value in this Area
Purchase History
| Date | Buyer | Sale Price | Title Company |
|---|---|---|---|
| Zhu Yunzhang | -- | None Available | |
| Zhu Yunzhang | -- | None Available | |
| Zhu Yunzhang | -- | None Available | |
| Zhu Yunzhang | $1,508,008 | Fidelity National Title | |
| Zhu Yunzhang | $1,508,008 | Fidelity National Title | |
| Zhu Yunzhang | $1,508,008 | Fidelity National Title | |
| Stylux Homes Inc | $805,000 | None Available | |
| Stylux Homes Inc | $805,000 | None Available | |
| Stylux Homes Inc | $805,000 | None Available | |
| Hamerman Randy | $337,500 | -- | |
| Hamerman Randy | $337,500 | -- |
Source: Public Records
Mortgage History
| Date | Status | Borrower | Loan Amount |
|---|---|---|---|
| Open | Zhu Yunzhang | $949,900 | |
| Closed | Zhu Yunzhang | $949,900 |
Source: Public Records
Tax History
| Year | Tax Paid | Tax Assessment Tax Assessment Total Assessment is a certain percentage of the fair market value that is determined by local assessors to be the total taxable value of land and additions on the property. | Land | Improvement |
|---|---|---|---|---|
| 2025 | $27,220 | $1,433 | $353 | $1,080 |
| 2024 | $8,172 | $1,433 | $353 | $1,080 |
Source: Public Records
Map
Nearby Homes
Your Personal Tour Guide
Ask me questions while you tour the home.