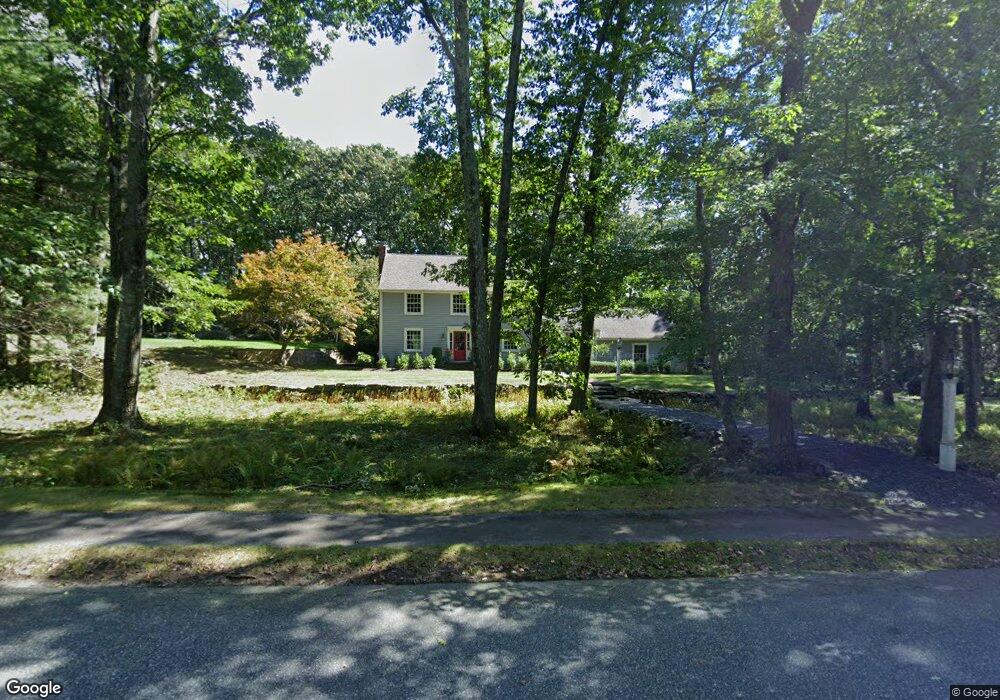
43 Ivy Ln Sherborn, MA 01770
Estimated Value: $1,267,258 - $1,551,000
4
Beds
3
Baths
3,316
Sq Ft
$414/Sq Ft
Est. Value
About This Home
This home is located at 43 Ivy Ln, Sherborn, MA 01770 and is currently estimated at $1,372,565, approximately $413 per square foot. 43 Ivy Ln is a home located in Middlesex County with nearby schools including Pine Hill Elementary School, Dover-Sherborn Regional Middle School, and Dover-Sherborn Regional High School.
Ownership History
Date
Name
Owned For
Owner Type
Purchase Details
Closed on
Jul 16, 2019
Sold by
Morrissey Michael E and Morrissey Nancy E
Bought by
Michael E Morrissey Lt
Current Estimated Value
Purchase Details
Closed on
Dec 31, 1998
Sold by
Anderson Thomas N and Anderson Diane E
Bought by
Morrissey Michael E and Morrissey Nancy E
Home Financials for this Owner
Home Financials are based on the most recent Mortgage that was taken out on this home.
Original Mortgage
$394,159
Interest Rate
6.84%
Mortgage Type
Purchase Money Mortgage
Purchase Details
Closed on
Jan 5, 1995
Sold by
Miller Gary L and Miller Carole J
Bought by
Anderson Thomas N and Anderson Diane E
Create a Home Valuation Report for This Property
The Home Valuation Report is an in-depth analysis detailing your home's value as well as a comparison with similar homes in the area
Home Values in the Area
Average Home Value in this Area
Purchase History
| Date | Buyer | Sale Price | Title Company |
|---|---|---|---|
| Michael E Morrissey Lt | -- | -- | |
| Morrissey Michael E | $430,000 | -- | |
| Anderson Thomas N | $370,000 | -- |
Source: Public Records
Mortgage History
| Date | Status | Borrower | Loan Amount |
|---|---|---|---|
| Previous Owner | Anderson Thomas N | $323,000 | |
| Previous Owner | Anderson Thomas N | $35,000 | |
| Previous Owner | Anderson Thomas N | $394,159 |
Source: Public Records
Tax History Compared to Growth
Tax History
| Year | Tax Paid | Tax Assessment Tax Assessment Total Assessment is a certain percentage of the fair market value that is determined by local assessors to be the total taxable value of land and additions on the property. | Land | Improvement |
|---|---|---|---|---|
| 2025 | $20,209 | $1,218,900 | $456,800 | $762,100 |
| 2024 | $18,916 | $1,116,000 | $456,800 | $659,200 |
| 2023 | $17,174 | $953,600 | $456,800 | $496,800 |
| 2022 | $15,928 | $837,000 | $446,300 | $390,700 |
| 2021 | $14,403 | $733,700 | $446,300 | $287,400 |
| 2020 | $14,278 | $733,700 | $446,300 | $287,400 |
| 2019 | $14,325 | $730,100 | $446,300 | $283,800 |
| 2018 | $6,059 | $720,900 | $446,300 | $274,600 |
| 2017 | $13,937 | $681,200 | $446,300 | $234,900 |
| 2016 | $13,837 | $672,700 | $446,300 | $226,400 |
| 2015 | $13,606 | $669,600 | $441,300 | $228,300 |
| 2014 | $12,922 | $635,300 | $421,300 | $214,000 |
Source: Public Records
Map
Nearby Homes
- 2 Surrey Ln
- 14 Sewall Brook Ln
- 4 Green Ln
- 65 Farm Road Lot 6
- 18 Wildwood Dr
- 20 Nason Hill Rd
- 220 S Main St
- 32 Lake St
- 105 N Main St
- 6 Brook St
- 54 Spywood Rd
- 38 Bullard St
- 00000 S Main St and Bullard St
- 27 Spywood Rd
- 15 Wyndemere Ln
- 21 Spywood Rd
- 81 Brush Hill Rd
- 114 Farm St
- 53 Yorkshire Rd
- 151 Mohawk Path