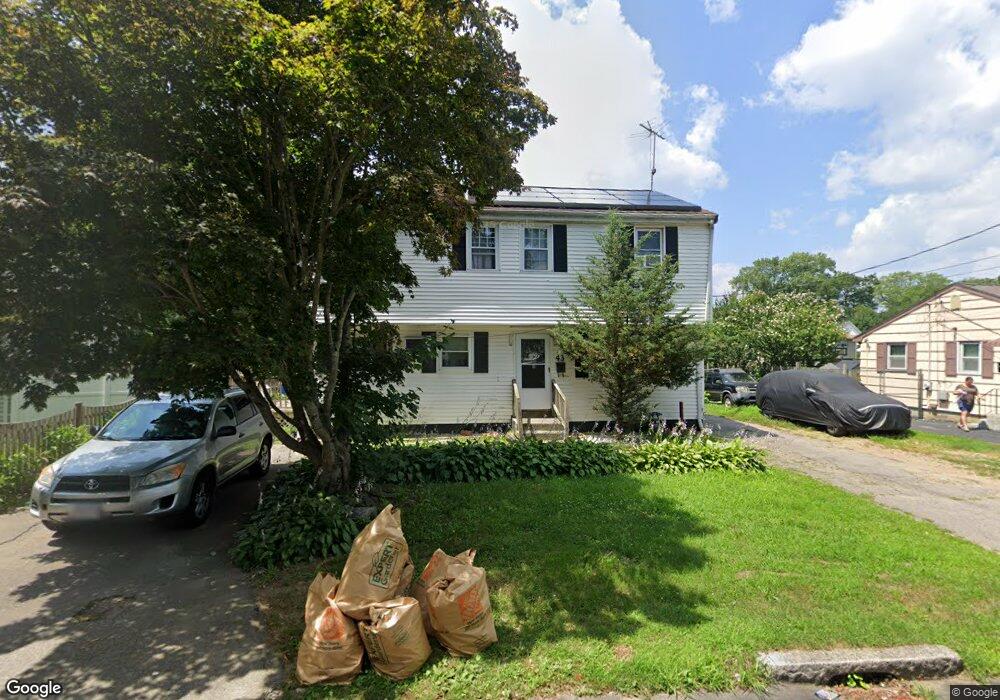
43 Jacob St Brockton, MA 02302
Estimated Value: $554,000 - $612,000
6
Beds
2
Baths
1,944
Sq Ft
$300/Sq Ft
Est. Value
About This Home
This home is located at 43 Jacob St, Brockton, MA 02302 and is currently estimated at $583,851, approximately $300 per square foot. 43 Jacob St is a home located in Plymouth County with nearby schools including Brookfield Elementary School, Downey Elementary School, and Ashfield Middle School.
Ownership History
Date
Name
Owned For
Owner Type
Purchase Details
Closed on
Nov 9, 2020
Sold by
Saintloth Joseph and Saintloth Marie J
Bought by
Ducena Ludiane
Current Estimated Value
Purchase Details
Closed on
May 31, 2007
Sold by
Saintloth Joseph and Sanitloth Marie J
Bought by
Saintloth Joseph and Sanitloth Marie J
Home Financials for this Owner
Home Financials are based on the most recent Mortgage that was taken out on this home.
Original Mortgage
$328,029
Interest Rate
6.24%
Mortgage Type
Purchase Money Mortgage
Purchase Details
Closed on
Jun 21, 2005
Sold by
Sheikh Muhammad Ali
Bought by
Saintloth Joseph and Saintloth Marie J
Home Financials for this Owner
Home Financials are based on the most recent Mortgage that was taken out on this home.
Original Mortgage
$260,000
Interest Rate
5.78%
Mortgage Type
Purchase Money Mortgage
Purchase Details
Closed on
Jul 15, 2004
Sold by
Khang Nou Kue
Bought by
Sheikh Muhammad and Ali Sarah
Purchase Details
Closed on
Aug 31, 1995
Sold by
Fhlmc
Bought by
Khang Nou Kue
Purchase Details
Closed on
Nov 1, 1994
Sold by
Killory Jerome V and Killory Charlotte I
Bought by
Fhlmc
Create a Home Valuation Report for This Property
The Home Valuation Report is an in-depth analysis detailing your home's value as well as a comparison with similar homes in the area
Home Values in the Area
Average Home Value in this Area
Purchase History
| Date | Buyer | Sale Price | Title Company |
|---|---|---|---|
| Ducena Ludiane | -- | None Available | |
| Saintloth Joseph | $325,000 | -- | |
| Saintloth Joseph | $325,000 | -- | |
| Sheikh Muhammad | $280,000 | -- | |
| Khang Nou Kue | $47,000 | -- | |
| Fhlmc | $98,000 | -- |
Source: Public Records
Mortgage History
| Date | Status | Borrower | Loan Amount |
|---|---|---|---|
| Previous Owner | Fhlmc | $328,029 | |
| Previous Owner | Fhlmc | $260,000 | |
| Previous Owner | Fhlmc | $65,000 |
Source: Public Records
Tax History Compared to Growth
Tax History
| Year | Tax Paid | Tax Assessment Tax Assessment Total Assessment is a certain percentage of the fair market value that is determined by local assessors to be the total taxable value of land and additions on the property. | Land | Improvement |
|---|---|---|---|---|
| 2025 | $5,853 | $483,300 | $140,200 | $343,100 |
| 2024 | $5,673 | $472,000 | $140,200 | $331,800 |
| 2023 | $5,688 | $438,200 | $104,900 | $333,300 |
| 2022 | $5,267 | $377,000 | $95,400 | $281,600 |
| 2021 | $5,349 | $368,900 | $79,400 | $289,500 |
| 2020 | $4,701 | $310,300 | $74,200 | $236,100 |
| 2019 | $4,611 | $296,700 | $72,400 | $224,300 |
| 2018 | $4,004 | $266,700 | $72,400 | $194,300 |
| 2017 | $4,004 | $248,700 | $72,400 | $176,300 |
| 2016 | $3,661 | $210,900 | $70,200 | $140,700 |
| 2015 | $3,648 | $201,000 | $70,200 | $130,800 |
| 2014 | $3,693 | $203,700 | $70,200 | $133,500 |
Source: Public Records
Map
Nearby Homes