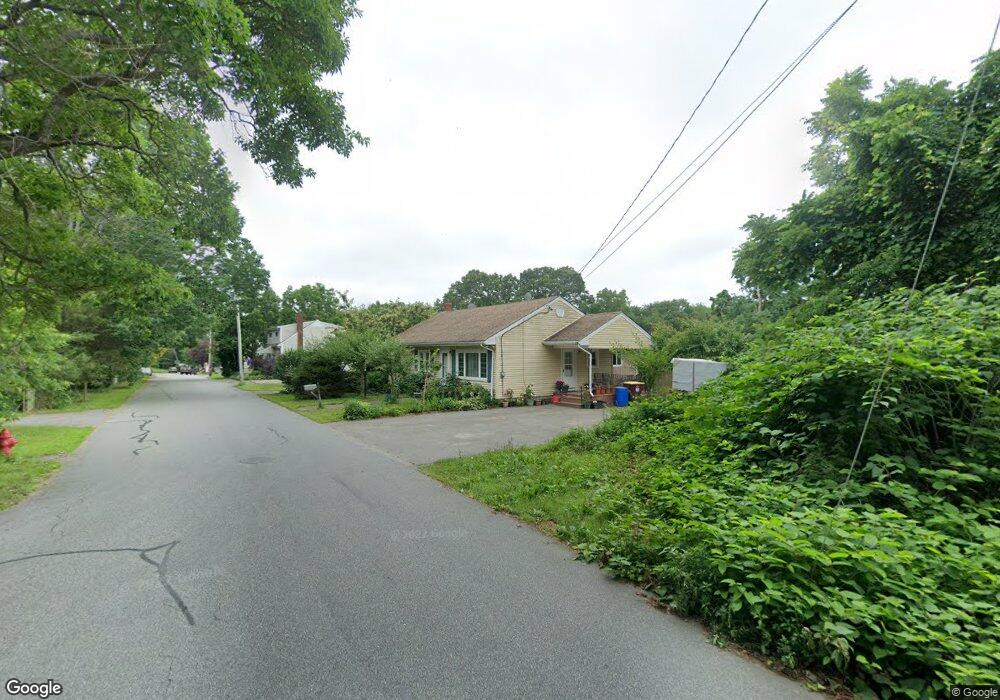
43 James St Acushnet, MA 02743
Estimated Value: $422,089 - $474,000
3
Beds
1
Bath
1,092
Sq Ft
$404/Sq Ft
Est. Value
About This Home
This home is located at 43 James St, Acushnet, MA 02743 and is currently estimated at $441,272, approximately $404 per square foot. 43 James St is a home located in Bristol County with nearby schools including Acushnet Elementary School, Albert F Ford Middle School, and Alma Del Mar Charter School.
Ownership History
Date
Name
Owned For
Owner Type
Purchase Details
Closed on
Jun 8, 2007
Sold by
Howell Kevin N and Howell Suzanne C
Bought by
Tavares Horacio O and Tavares Marisa V
Current Estimated Value
Home Financials for this Owner
Home Financials are based on the most recent Mortgage that was taken out on this home.
Original Mortgage
$130,000
Outstanding Balance
$76,722
Interest Rate
6.17%
Mortgage Type
Purchase Money Mortgage
Estimated Equity
$364,550
Purchase Details
Closed on
Oct 28, 2003
Sold by
Avila Brian G and Avila Elizabeth A
Bought by
Howell Kevin N and Howell Suzanne C
Home Financials for this Owner
Home Financials are based on the most recent Mortgage that was taken out on this home.
Original Mortgage
$208,075
Interest Rate
6.15%
Mortgage Type
Purchase Money Mortgage
Create a Home Valuation Report for This Property
The Home Valuation Report is an in-depth analysis detailing your home's value as well as a comparison with similar homes in the area
Home Values in the Area
Average Home Value in this Area
Purchase History
We collect this data history from publicly available records. To have your information removed, we recommend requesting removal directly through your county’s website.
| Date | Buyer | Sale Price | Title Company |
|---|---|---|---|
| Tavares Horacio O | $230,000 | -- | |
| Howell Kevin N | $222,900 | -- |
Source: Public Records
Mortgage History
We collect this data history from publicly available records. To have your information removed, we recommend requesting removal directly through your county’s website.
| Date | Status | Borrower | Loan Amount |
|---|---|---|---|
| Open | Howell Kevin N | $130,000 | |
| Previous Owner | Howell Kevin N | $245,500 | |
| Previous Owner | Howell Kevin N | $208,075 |
Source: Public Records
Tax History
| Year | Tax Paid | Tax Assessment Tax Assessment Total Assessment is a certain percentage of the fair market value that is determined by local assessors to be the total taxable value of land and additions on the property. | Land | Improvement |
|---|---|---|---|---|
| 2025 | $37 | $341,200 | $98,000 | $243,200 |
| 2024 | $3,504 | $307,100 | $93,700 | $213,400 |
| 2023 | $3,392 | $282,700 | $85,200 | $197,500 |
| 2022 | $3,363 | $253,400 | $81,000 | $172,400 |
| 2021 | $3,202 | $231,500 | $81,000 | $150,500 |
| 2020 | $3,227 | $231,500 | $81,000 | $150,500 |
| 2019 | $3,141 | $221,500 | $81,000 | $140,500 |
| 2018 | $3,027 | $209,900 | $81,000 | $128,900 |
| 2017 | $2,915 | $201,900 | $81,000 | $120,900 |
| 2016 | $2,838 | $195,300 | $81,000 | $114,300 |
| 2015 | $2,685 | $188,000 | $81,000 | $107,000 |
Source: Public Records
Map
Nearby Homes
Your Personal Tour Guide
Ask me questions while you tour the home.