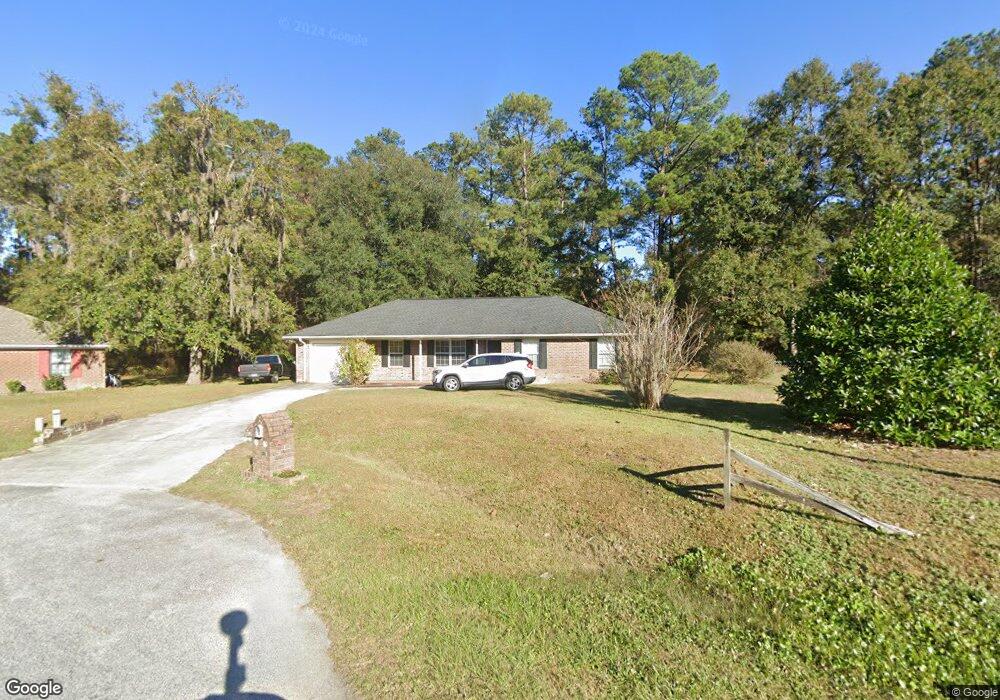
43 Jessica Ct Unit n/a Allenhurst, GA 31301
Estimated Value: $207,000 - $246,000
4
Beds
2
Baths
1,569
Sq Ft
$145/Sq Ft
Est. Value
About This Home
This home is located at 43 Jessica Ct Unit n/a, Allenhurst, GA 31301 and is currently estimated at $227,801, approximately $145 per square foot. 43 Jessica Ct Unit n/a is a home located in Liberty County with nearby schools including Frank Long Elementary School, Lewis Frasier Middle School, and Liberty County High School.
Ownership History
Date
Name
Owned For
Owner Type
Purchase Details
Closed on
Mar 12, 2018
Sold by
Milan Edward
Bought by
Belden Carlton Ray and Belden Cheryl Marie
Current Estimated Value
Home Financials for this Owner
Home Financials are based on the most recent Mortgage that was taken out on this home.
Original Mortgage
$133,816
Outstanding Balance
$114,506
Interest Rate
4.32%
Mortgage Type
VA
Estimated Equity
$113,295
Purchase Details
Closed on
Dec 1, 2014
Sold by
Grooms Enterprises Inc
Bought by
Milan Edward
Home Financials for this Owner
Home Financials are based on the most recent Mortgage that was taken out on this home.
Original Mortgage
$107,025
Interest Rate
4.37%
Mortgage Type
FHA
Purchase Details
Closed on
Mar 27, 2014
Sold by
Federal National Mortgage Association
Bought by
Grooms Enterprises Inc
Purchase Details
Closed on
Sep 3, 2013
Sold by
Reverse Mtg Solutions Inc
Bought by
Federal National Mtg Associati
Purchase Details
Closed on
Mar 31, 1995
Bought by
Jenkins Harris B
Create a Home Valuation Report for This Property
The Home Valuation Report is an in-depth analysis detailing your home's value as well as a comparison with similar homes in the area
Home Values in the Area
Average Home Value in this Area
Purchase History
| Date | Buyer | Sale Price | Title Company |
|---|---|---|---|
| Belden Carlton Ray | $131,000 | -- | |
| Milan Edward | $113,625 | -- | |
| Grooms Enterprises Inc | $60,000 | -- | |
| Federal National Mtg Associati | $97,256 | -- | |
| Reverse Mtg Solutions Inc | $97,256 | -- | |
| Jenkins Harris B | $75,000 | -- |
Source: Public Records
Mortgage History
| Date | Status | Borrower | Loan Amount |
|---|---|---|---|
| Open | Belden Carlton Ray | $133,816 | |
| Previous Owner | Milan Edward | $107,025 |
Source: Public Records
Tax History Compared to Growth
Tax History
| Year | Tax Paid | Tax Assessment Tax Assessment Total Assessment is a certain percentage of the fair market value that is determined by local assessors to be the total taxable value of land and additions on the property. | Land | Improvement |
|---|---|---|---|---|
| 2024 | $2,998 | $72,388 | $14,000 | $58,388 |
| 2023 | $2,998 | $66,729 | $10,000 | $56,729 |
| 2022 | $2,166 | $55,882 | $10,000 | $45,882 |
| 2021 | $1,977 | $51,172 | $10,000 | $41,172 |
| 2020 | $1,858 | $47,880 | $10,000 | $37,880 |
| 2019 | $1,793 | $47,429 | $10,000 | $37,429 |
| 2018 | $1,738 | $46,528 | $10,000 | $36,528 |
| 2017 | $1,993 | $46,978 | $10,000 | $36,978 |
| 2016 | $1,649 | $47,429 | $10,000 | $37,429 |
| 2015 | $1,738 | $45,558 | $10,000 | $35,558 |
| 2014 | $1,738 | $49,466 | $10,000 | $39,466 |
| 2013 | -- | $46,414 | $10,000 | $36,414 |
Source: Public Records
Map
Nearby Homes
- 100 Mccumber Dr
- 7.22 AC Dunlevie Rd
- 996 Dunlevie Rd
- 166 Stephanie Dr
- 480 Mccumber Dr
- 534 Deer Meadow Way
- 685 Deer Meadow Way
- 256 Deer Meadow Way
- 684 Deer Meadow Way
- 726 Deer Meadow Way
- 514 Deer Meadow Way
- 554 Deer Meadow Way
- 704 Deer Meadow Way
- 575 Deer Meadow Way
- 593 Deer Meadow Way
- 662 Deer Meadow Way
- 374 Deer Meadow Way
- 663 Deer Meadow Way
- 645 Deer Meadow Way
- 625 Deer Meadow Way