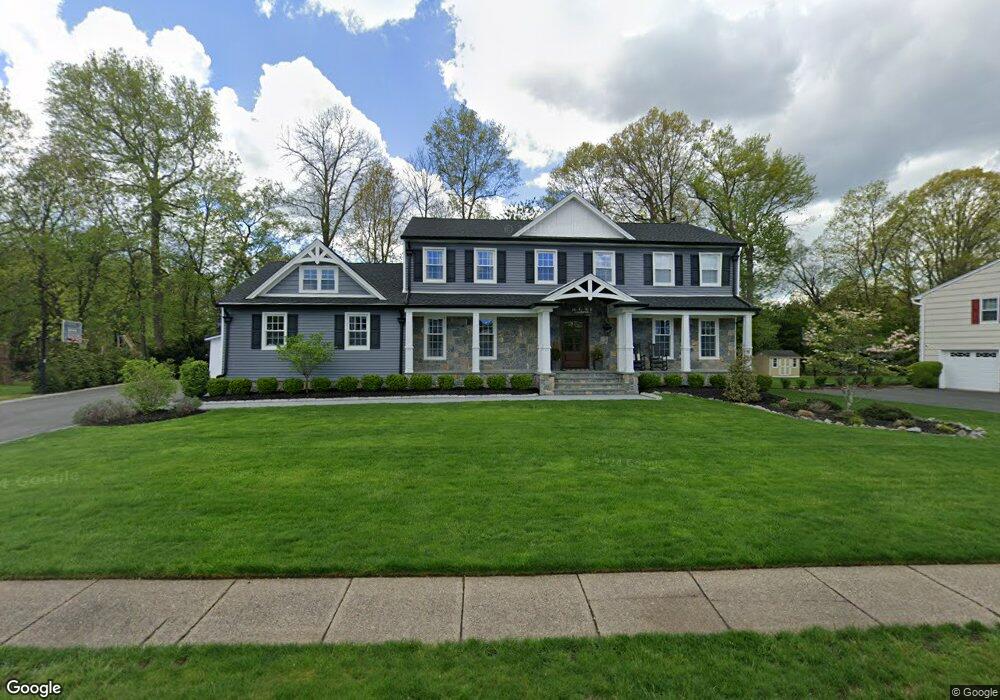
43 John St Fairfield, NJ 07004
Estimated Value: $1,025,000 - $1,416,000
Studio
--
Bath
3,255
Sq Ft
$362/Sq Ft
Est. Value
About This Home
This home is located at 43 John St, Fairfield, NJ 07004 and is currently estimated at $1,178,868, approximately $362 per square foot. 43 John St is a home located in Essex County with nearby schools including Adlai E Stevenson School, Churchill, and West Essex Middle School.
Ownership History
Date
Name
Owned For
Owner Type
Purchase Details
Closed on
Feb 25, 2016
Sold by
Alicandri Patricia and Alicandri Thomas J
Bought by
Cosentino Marcello and Cosentino Sabrina
Current Estimated Value
Home Financials for this Owner
Home Financials are based on the most recent Mortgage that was taken out on this home.
Original Mortgage
$415,000
Outstanding Balance
$330,207
Interest Rate
3.81%
Mortgage Type
New Conventional
Estimated Equity
$848,661
Purchase Details
Closed on
May 5, 2013
Bought by
Alicandri Patricia
Create a Home Valuation Report for This Property
The Home Valuation Report is an in-depth analysis detailing your home's value as well as a comparison with similar homes in the area
Home Values in the Area
Average Home Value in this Area
Purchase History
| Date | Buyer | Sale Price | Title Company |
|---|---|---|---|
| Cosentino Marcello | $550,000 | Passaic Valley Title Service | |
| Alicandri Patricia | -- | -- |
Source: Public Records
Mortgage History
| Date | Status | Borrower | Loan Amount |
|---|---|---|---|
| Open | Cosentino Marcello | $415,000 |
Source: Public Records
Tax History
| Year | Tax Paid | Tax Assessment Tax Assessment Total Assessment is a certain percentage of the fair market value that is determined by local assessors to be the total taxable value of land and additions on the property. | Land | Improvement |
|---|---|---|---|---|
| 2025 | $15,104 | $735,700 | $280,500 | $455,200 |
| 2024 | $15,104 | $735,700 | $280,500 | $455,200 |
Source: Public Records
Map
Nearby Homes
- 19 West Dr
- 20 West Dr
- 5 Addison Dr
- 74 Camp Ln
- 584-588 U S 46
- 78 Lane Rd Unit 1
- 131 Horseneck Rd
- 128 Big Piece Rd
- 8 Winfield Ct
- 82 Stonyridge Dr Unit 82
- 96 Pier Ln
- 73 Big Piece Rd
- 53 Alpine Dr Unit Y156
- 20 Barnsdale Rd
- 34 Carlos Dr
- 76 Ryan Ln Unit J52
- 76 Ryan Ln Unit 1001
- 52 Ryan Ln Unit 1105
- 52 Ryan Ln Unit K64
- 101 Seminole Ave
Your Personal Tour Guide
Ask me questions while you tour the home.